
Giám sát Palo Alto bằng Zabbix 7.4 + Grafana — tách băng thông Trong nước / Quốc tế
Đồ thị băng thông WAN báo 500 Mbps. Trong đó bao nhiêu đi ra nước ngoài? SNMP không trả lời được câu đó. Counter ifHCInOctets trên interface WAN chỉ đếm tổng octet đi qua — nó không biết gói vừa về là từ vnexpress.net hay từ một server đặt ở Pháp. Nhưng đúng phần bị nó gộp chung mới là phần đắt tiền: với ISP lẫn doanh nghiệp thuê kênh, cước quốc tế và cước trong nước không cùng một giá.
Lab tách con số đó ngay trên firewall Palo Alto rồi vẽ ra Grafana — 5 container trên một VM Ubuntu, cộng PA-VM làm đối tượng giám sát:
- Ubuntu định tuyến ra internet xuyên qua PA (LAN → WAN → NAT).
- Zabbix poll SNMP interface WAN của PA → panel Tổng băng thông (download + upload).
- PA phân loại download theo IP nguồn (dải IP Việt Nam = Trong nước, còn lại = Quốc tế) bằng QoS + EDL; Zabbix gọi PA XML API đọc throughput từng lớp → panel TN/QT riêng.
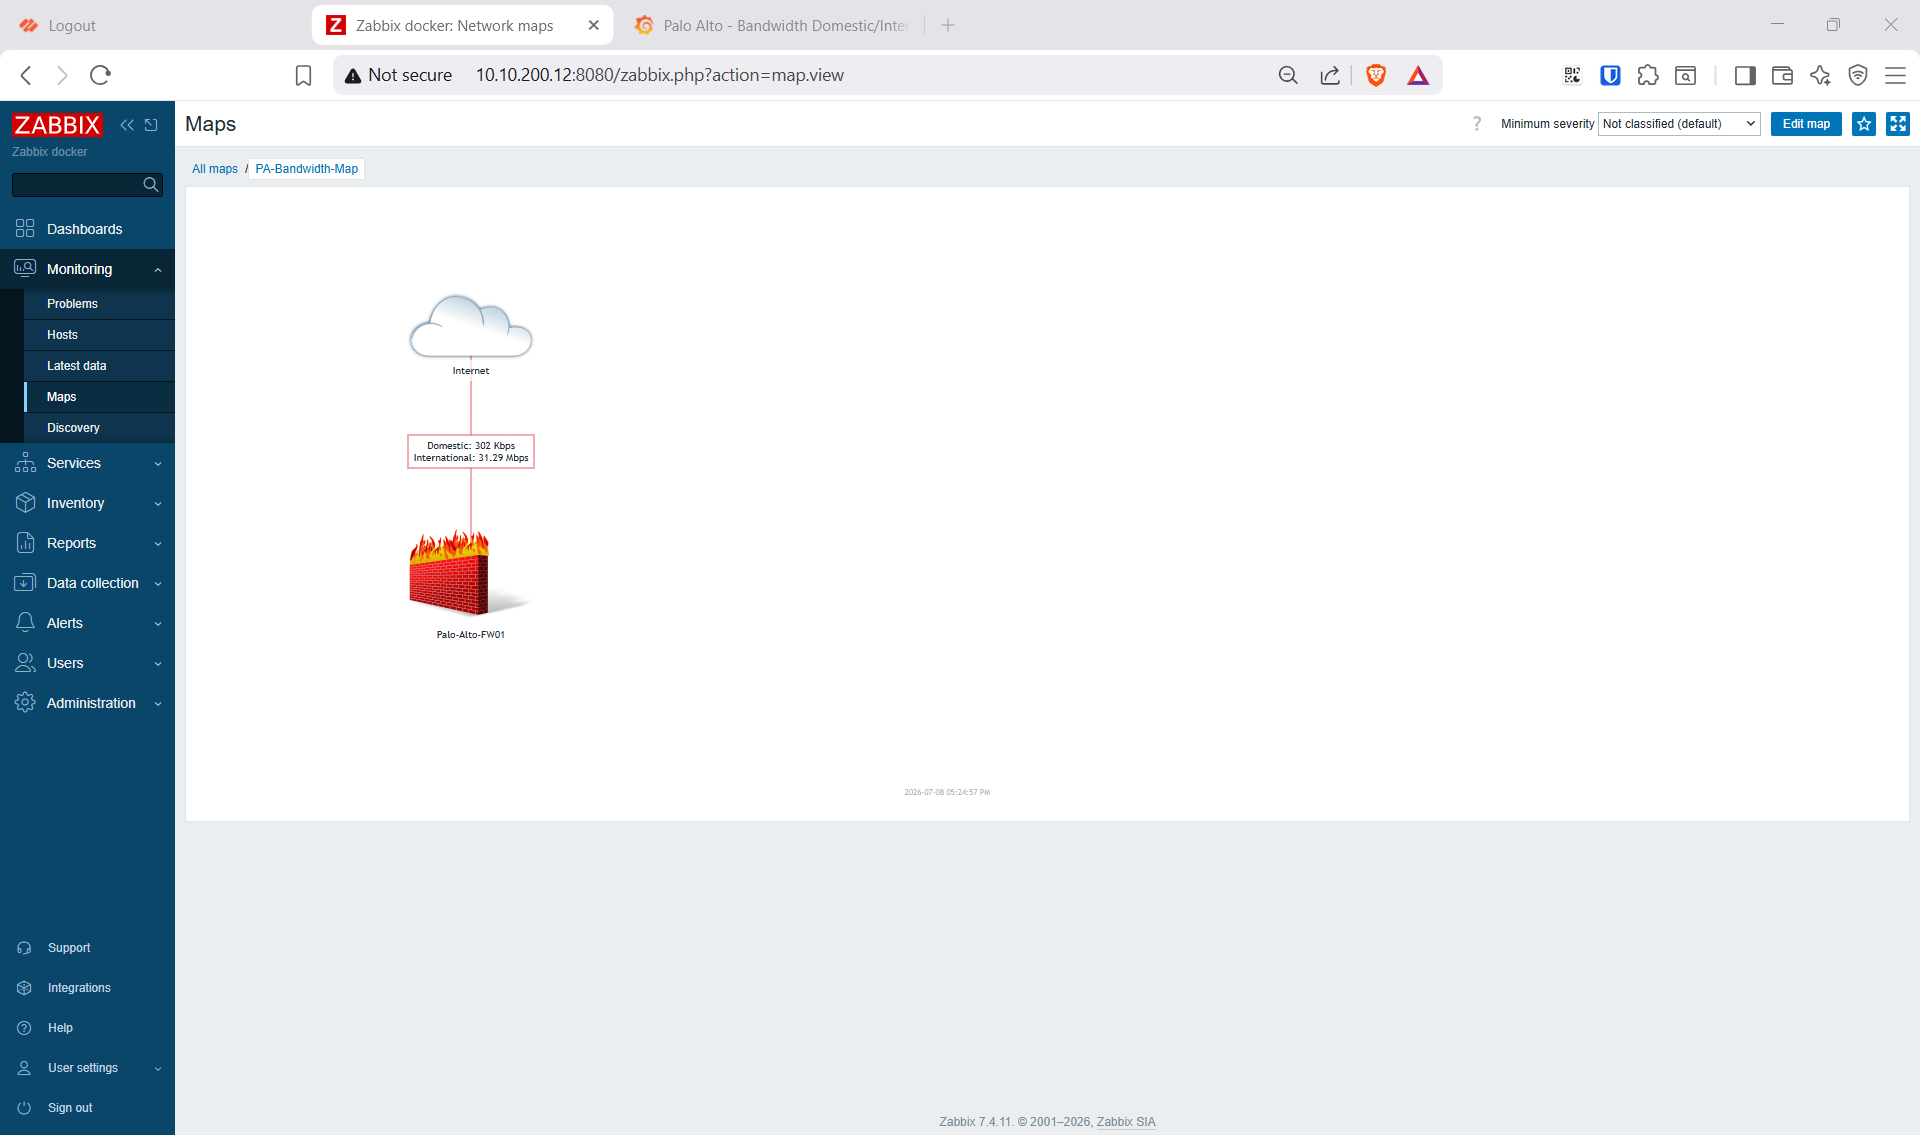
- Grafana ghép hai nguồn số liệu, Zabbix Network Map tái hiện topology kiểu sơ đồ giám sát ISP.
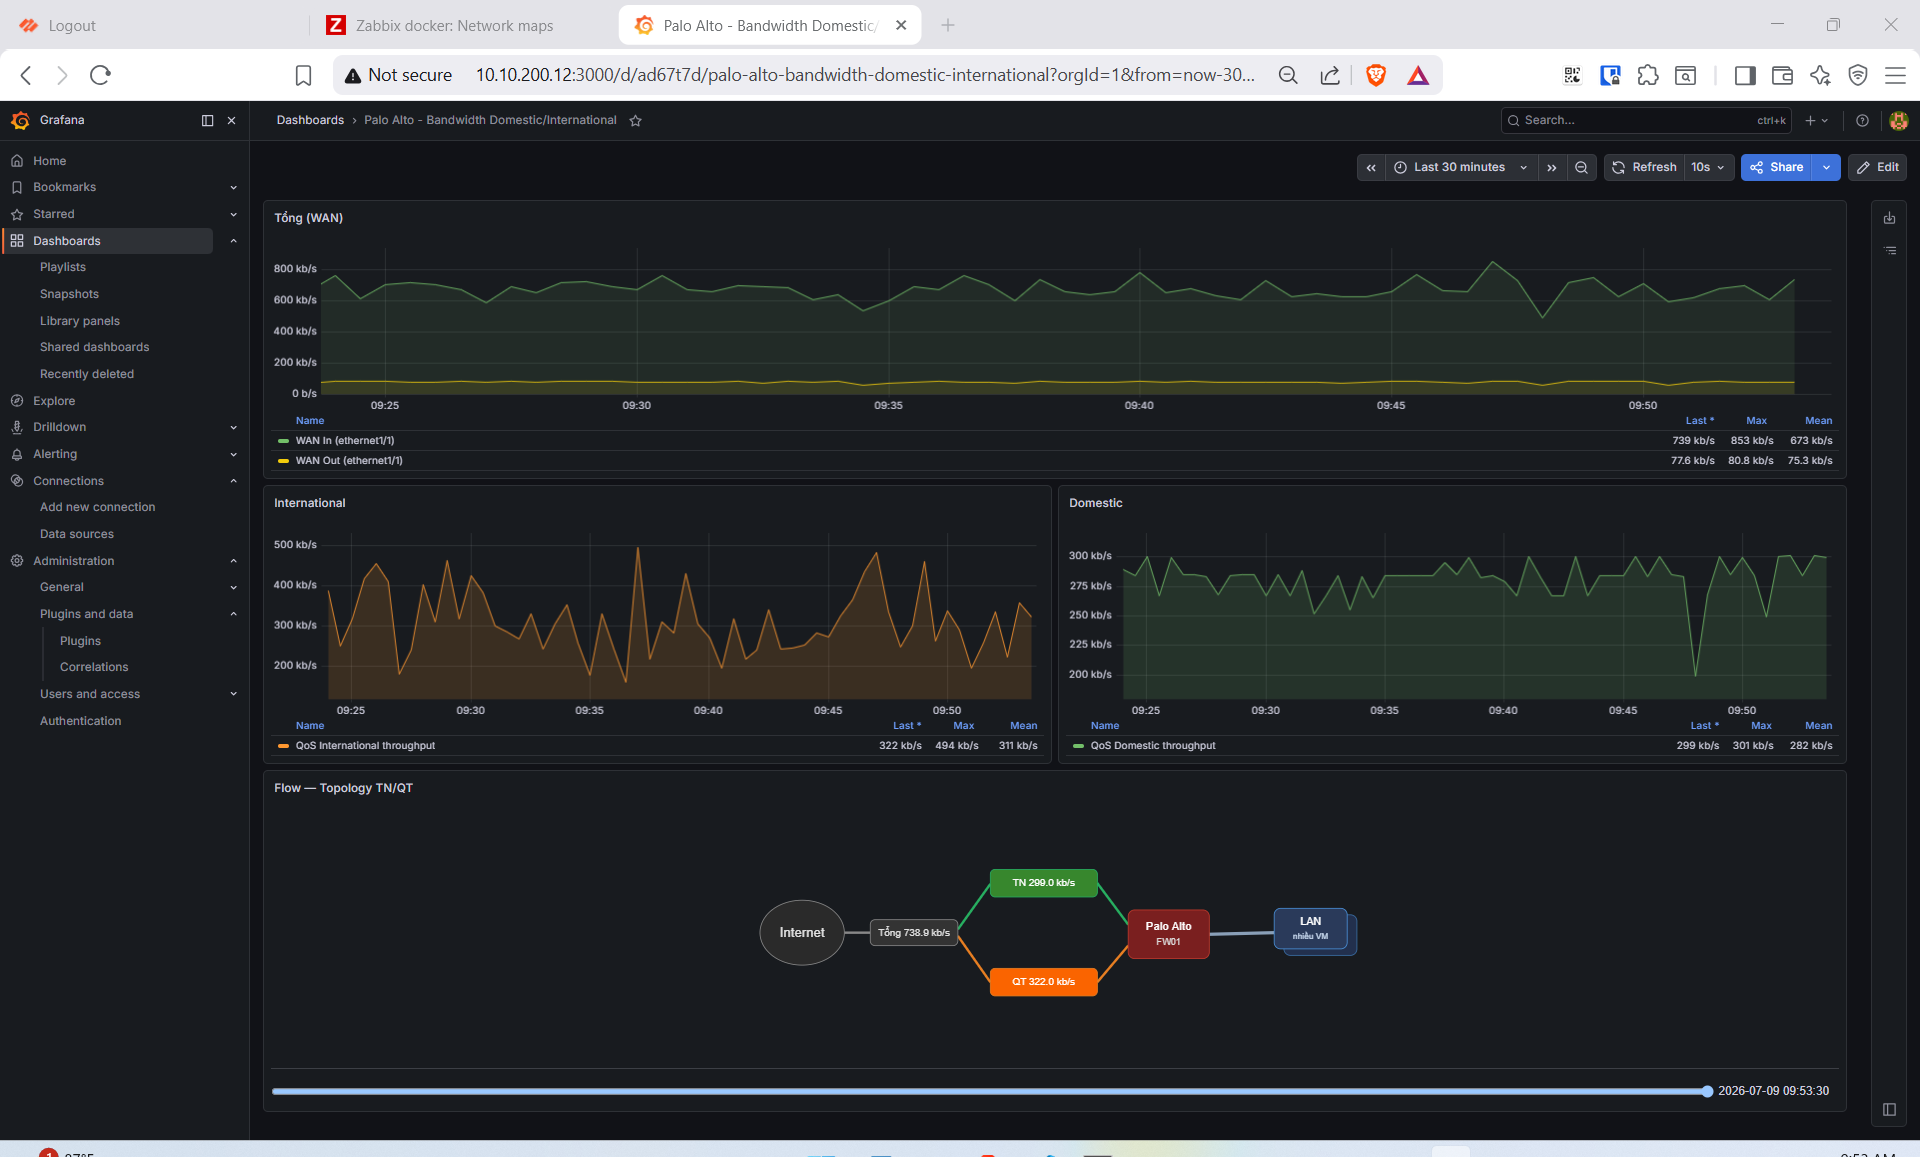
- Palo Alto PA-VM — gateway LAN→WAN của lab, đồng thời là nguồn số liệu: SNMP counter cho phần Tổng, QoS class throughput qua API cho phần TN/QT.
- Zabbix 7.4 — vừa poll SNMP interface, vừa dùng HTTP agent gọi PA API lấy số liệu QoS.
- PostgreSQL — database của Zabbix.
- Grafana — vẽ time-series, nối Zabbix qua plugin
alexanderzobnin-zabbix-app.
Vì sao QoS + API chứ không thêm OID SNMP? QoS là cơ chế native duy nhất trên PA đo được băng thông theo lớp phân loại, và số liệu từng class chỉ đọc được qua XML API. Nên chia việc: SNMP cho Tổng, QoS + API cho TN/QT.
Vì sao đo chiều download? Băng thông thực tế bị chi phối bởi download (upload chỉ là ACK vài trăm kb/s). Download đi ra ở interface LAN (
eth1/2) nên QoS đặt ở đó. Hệ quả: Tổng (WAN In) ≈ TN + QT — khớp nhau vì cùng đo một luồng.Phân loại theo IP, không theo tên miền. Google, Facebook, YouTube, Netflix đều đặt cache node trong ISP Việt Nam (GGC, Open Connect) → IP là VN → PA xếp vào Trong nước. Đúng góc nhìn ISP: traffic peering nội địa không tính cước quốc tế. Muốn thấy Quốc tế rõ ràng, chọn site không có PoP tại VN (
proof.ovh.net— OVH Pháp,speedtest.tele2.net— Thụy Điển) và tránh Cloudflare/Google/YouTube, chúng hay bị EDL xếp nhầm vào dải VN → ra nhầm class 4 (TN).
- Mục tiêu
- Môi trường
- Kiến trúc và luồng dữ liệu
- Chuẩn bị
- Step 0: Bootstrap PA qua console
- Step 1: Hoàn tất cấu hình PA qua SSH
- Step 2: Danh sách IP Việt Nam bằng EDL
- Step 3: QoS phân loại TN và QT
- Step 4: API key và lệnh đọc throughput
- Step 5: Cấu hình mạng Ubuntu và cài Docker
- Step 6: Docker compose Zabbix, Postgres, Grafana
- Step 7: Thêm host PA vào Zabbix
- Step 8: Grafana dashboard
- Step 9: Zabbix Network Map
- Step 10: Sinh traffic và kiểm chứng
- Kiểm tra kết quả
- Kết luận
Mục tiêu
- Giám sát tổng băng thông WAN của Palo Alto bằng Zabbix qua SNMPv2c.
- Tách riêng lưu lượng download Trong nước (TN) và Quốc tế (QT) dựa trên IP internet, dùng QoS + EDL trên PA + Zabbix HTTP agent gọi PA API.
- Dashboard Grafana: panel Tổng + panel TN + panel QT, có hiện số Last/Max dưới đồ thị.
- Zabbix Network Map tái hiện topology (cloud Internet ↔ PA, link nhãn TN/QT + đổi màu theo tải).
Môi trường
| VM | OS | vCPU/RAM | Disk | NIC |
|---|---|---|---|---|
| Palo-Alto-FW01 | PAN-OS 11.0 (PA-VM) | 2 / 6 GB | 60 GB | NIC1 mgmt (VLAN200), NIC2 eth1/1 WAN (VLAN200), NIC3 eth1/2 LAN (VLAN201) |
| Zabbix01 | Ubuntu 24.04 | 8 / 8 GB | 100 GB | NIC1 ens160 (VLAN200), NIC2 ens192 (VLAN201) |
Bảng IP:
| Thiết bị | Interface | IP | Vai trò |
|---|---|---|---|
| Palo-Alto-FW01 | eth1/1 (WAN) | 10.10.200.11/24 |
Default route → gateway 10.10.200.1; quản trị HTTPS/SSH |
| Palo-Alto-FW01 | eth1/2 (LAN) | 10.10.201.11/24 |
Gateway cho Ubuntu; chịu SNMP + API cho Zabbix |
| Zabbix01 | ens160 (VLAN200) | 10.10.200.12/24 |
Đường quản trị: SSH + web Zabbix/Grafana từ laptop |
| Zabbix01 | ens192 (VLAN201) | 10.10.201.12/24 |
Traffic ra internet đi qua PA (để QoS phân loại) |
2 VM. Gateway VLAN200
10.10.200.1là router NAT sẵn có, mở outbound53/80/123/443(cấm ICMP). Laptop quản trị ở dải172.16.10.0/24.
Kiến trúc và luồng dữ liệu
  curl mirror trong nước (TN)   curl proof.ovh.net (QT)
             \                    /
        Zabbix01 ens192 (VLAN201) 10.10.201.12
                     │  default route → PA
                     ▼
     ┌────────── [ PA eth1/2 LAN 10.10.201.11 ] ◄── download RA đây → QoS tách TN/QT
     │                    │
     │   QoS phân loại theo IP internet:
     │     ∈ VN (EDL) → class 4 (TN) | còn lại → class 5 (QT)
     │                    ▼
     │            [ PA eth1/1 WAN 10.10.200.11 ] ◄── download VÀO đây → SNMP đếm = Tổng
     │                    │
     │                    ▼  NAT → gw .1 → Internet
     │
     └─► Zabbix (container trên Zabbix01) poll PA qua 10.10.201.11:
             SNMP  → ifHCInOctets/OutOctets eth1/1  = Tổng
             HTTPS API → QoS throughput eth1/2 node download = TN / QT
- Tổng = SNMP
ifHCInOctets/OutOctetscủaethernet1/1(download vào + upload ra trên WAN). - TN/QT = QoS class 4/5 đo ở
ethernet1/2egress (download ra LAN). Cùng luồng download nên Tổng In ≈ TN + QT.
Chuẩn bị
- Có sẵn 2 mạng: VLAN 200 (ra internet qua gateway
10.10.200.1) và VLAN 201 (LAN nội bộ, isolated). -
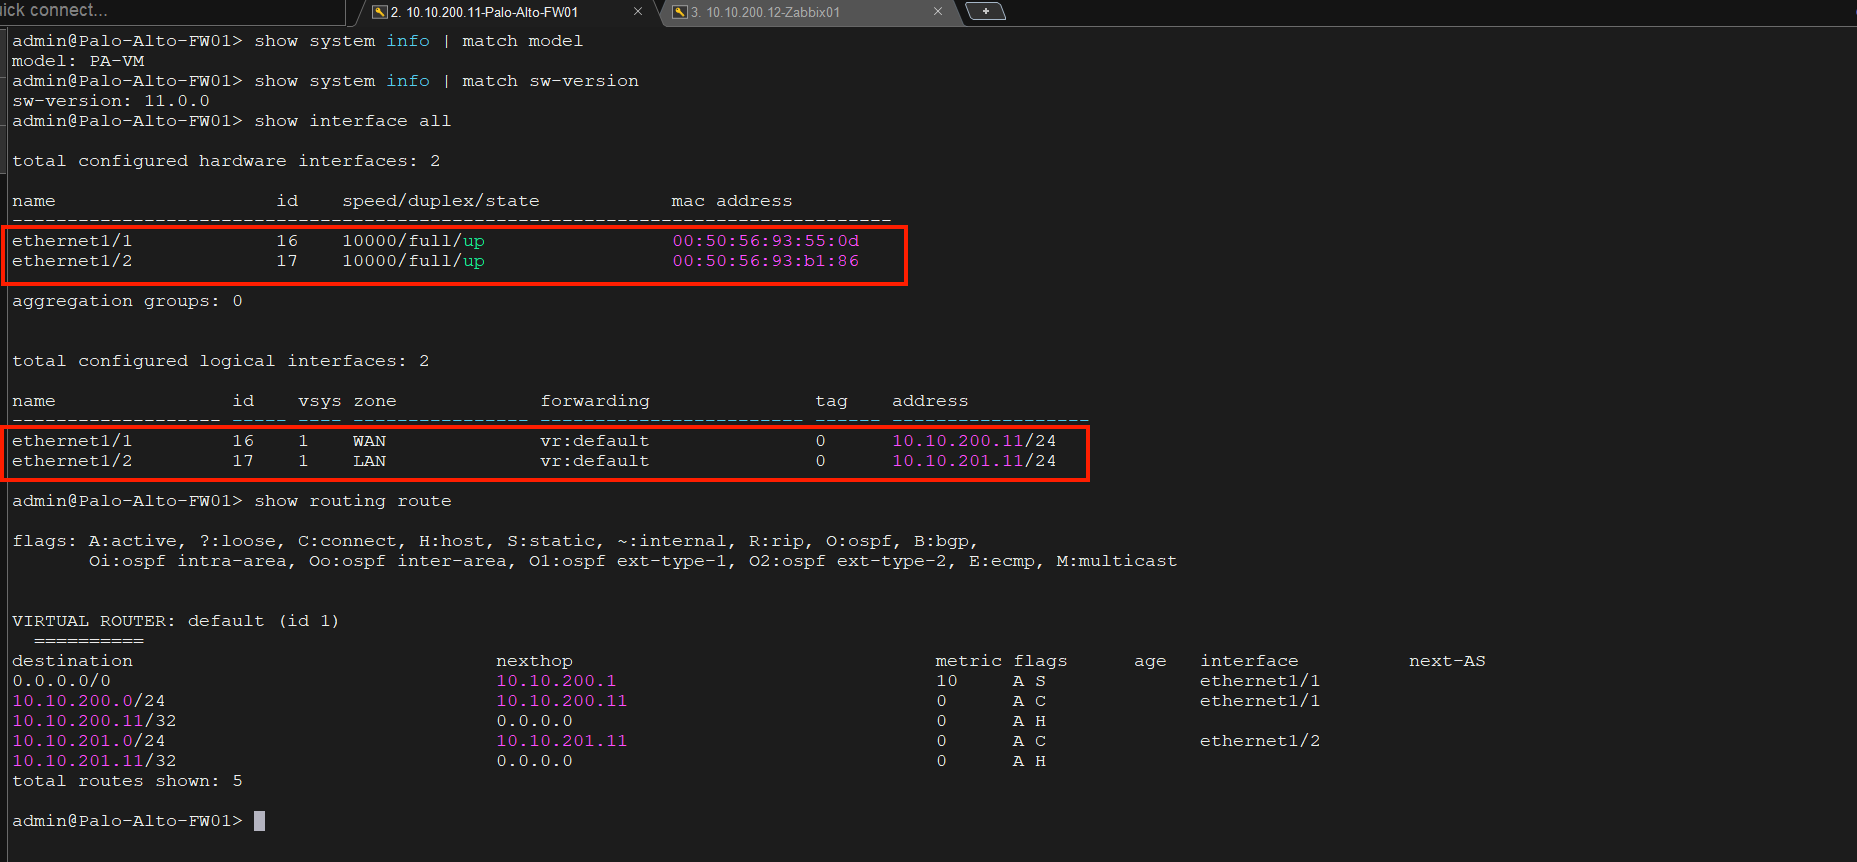
Deploy PA-VM 11.0, gán đúng 3 vNIC theo thứ tự — điểm dễ sai nhất của PA-VM: vNIC1 luôn là mgmt, dataplane bắt đầu từ vNIC2:
Network adapter PA interface VLAN Adapter 1 mgmt (không dùng trong lab) VLAN200 Adapter 2 ethernet1/1 (WAN) VLAN200 Adapter 3 ethernet1/2 (LAN) VLAN201 mgmt (Adapter 1) chỉ quản trị, không forward traffic transit — nên vẫn cần WAN (Adapter 2) + LAN (Adapter 3) riêng. Lab này không dùng mgmt, quản trị PA qua WAN
10.10.200.11. Thêm vNIC phải reboot PA mới nhận interface (show interface allphải thấyethernet1/1+ethernet1/2). - Đăng nhập PA lần đầu qua console: mặc định
admin/admin, hệ thống bắt buộc đổi password ngay — đặt<pa-admin-password>.
Step 0: Bootstrap PA qua console
Mục tiêu: dựng interface + bật HTTPS/SSH trên WAN để từ đây SSH vào 10.10.200.11 paste phần còn lại (đỡ gõ tay trên console).
Vào console PA-VM, chạy:
configure

# Hostname
set deviceconfig system hostname Palo-Alto-FW01

# Interface WAN + LAN
set network interface ethernet ethernet1/1 layer3 ip 10.10.200.11/24
set network interface ethernet ethernet1/2 layer3 ip 10.10.201.11/24

# Zone
set zone WAN network layer3 ethernet1/1
set zone LAN network layer3 ethernet1/2

# Virtual router + default route ra gateway
set network virtual-router default interface [ ethernet1/1 ethernet1/2 ]
set network virtual-router default routing-table ip static-route default destination 0.0.0.0/0 nexthop ip-address 10.10.200.1

# Cho phép HTTPS + SSH quản trị trên WAN
set network profiles interface-management-profile MGMT-WAN https yes ssh yes ping yes
set network interface ethernet ethernet1/1 layer3 interface-management-profile MGMT-WAN

commit
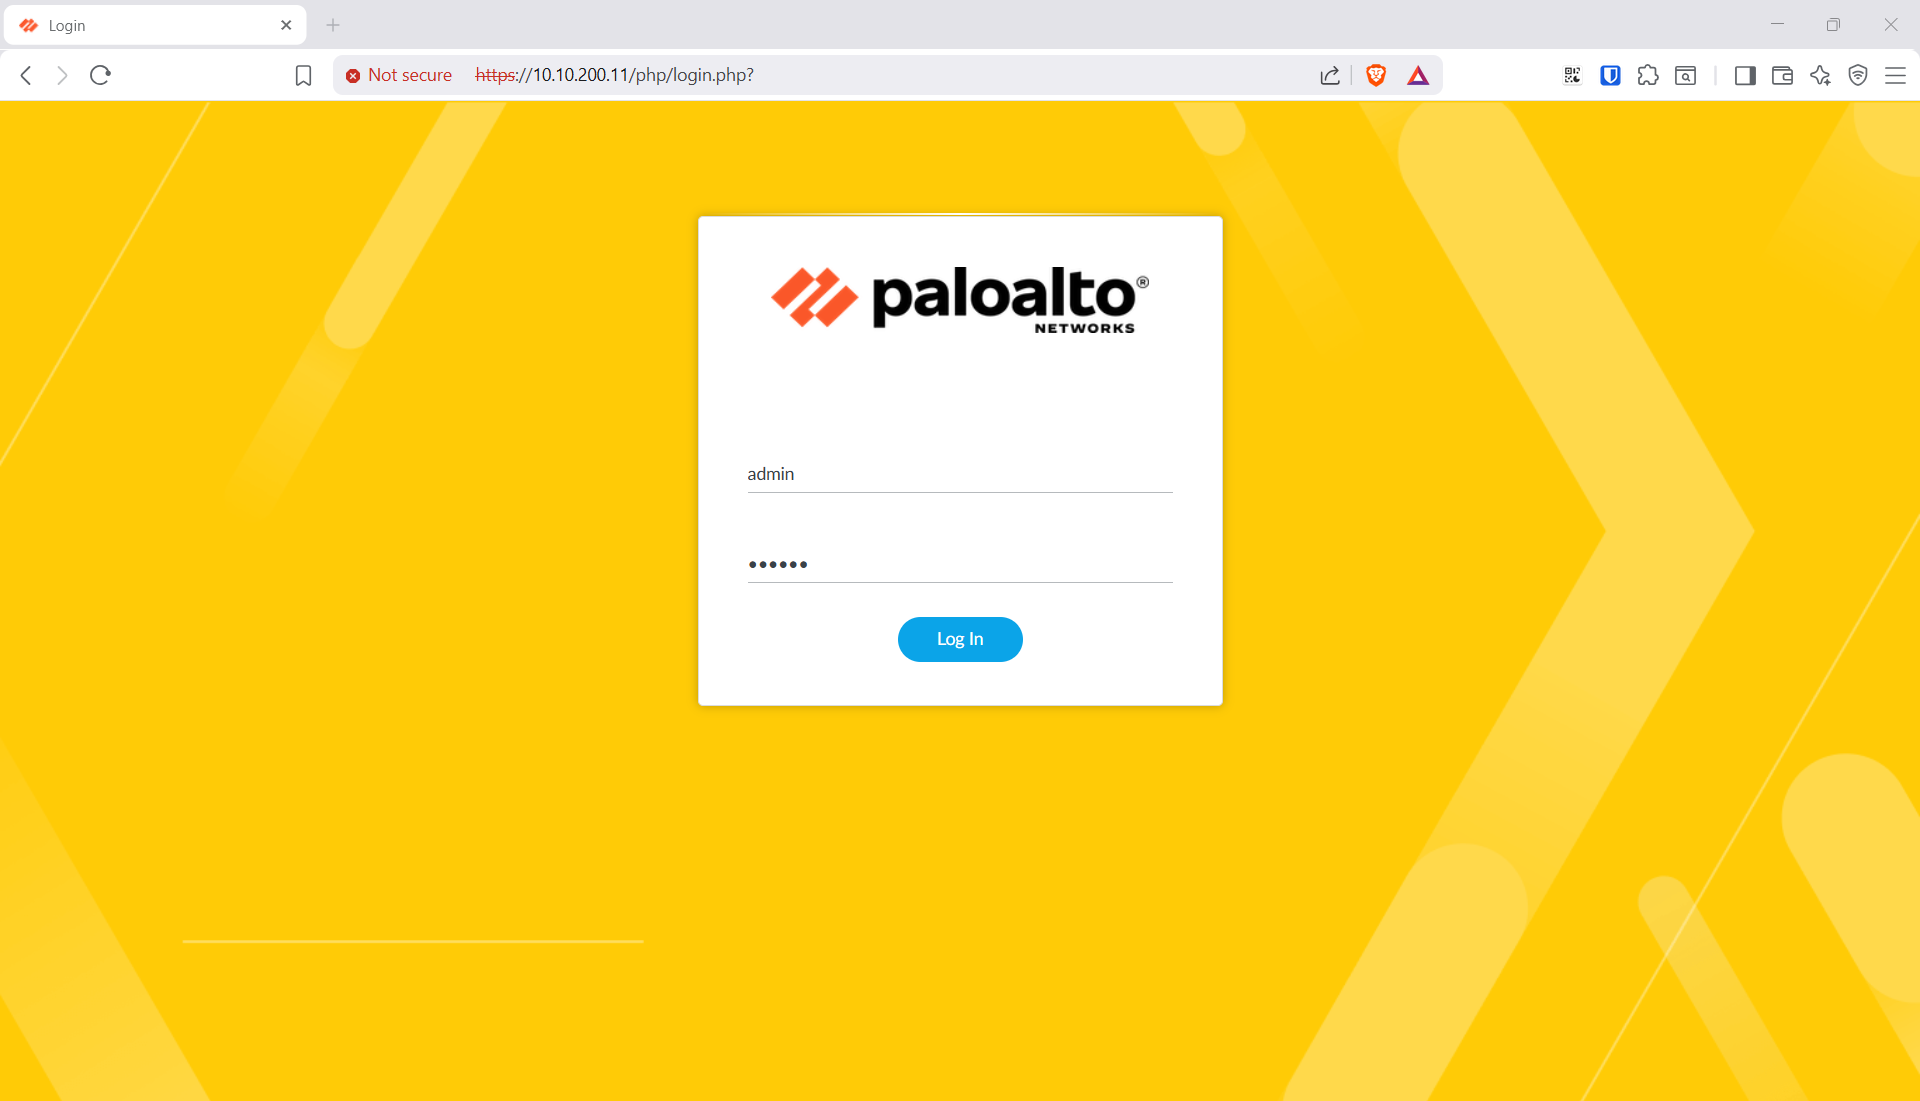
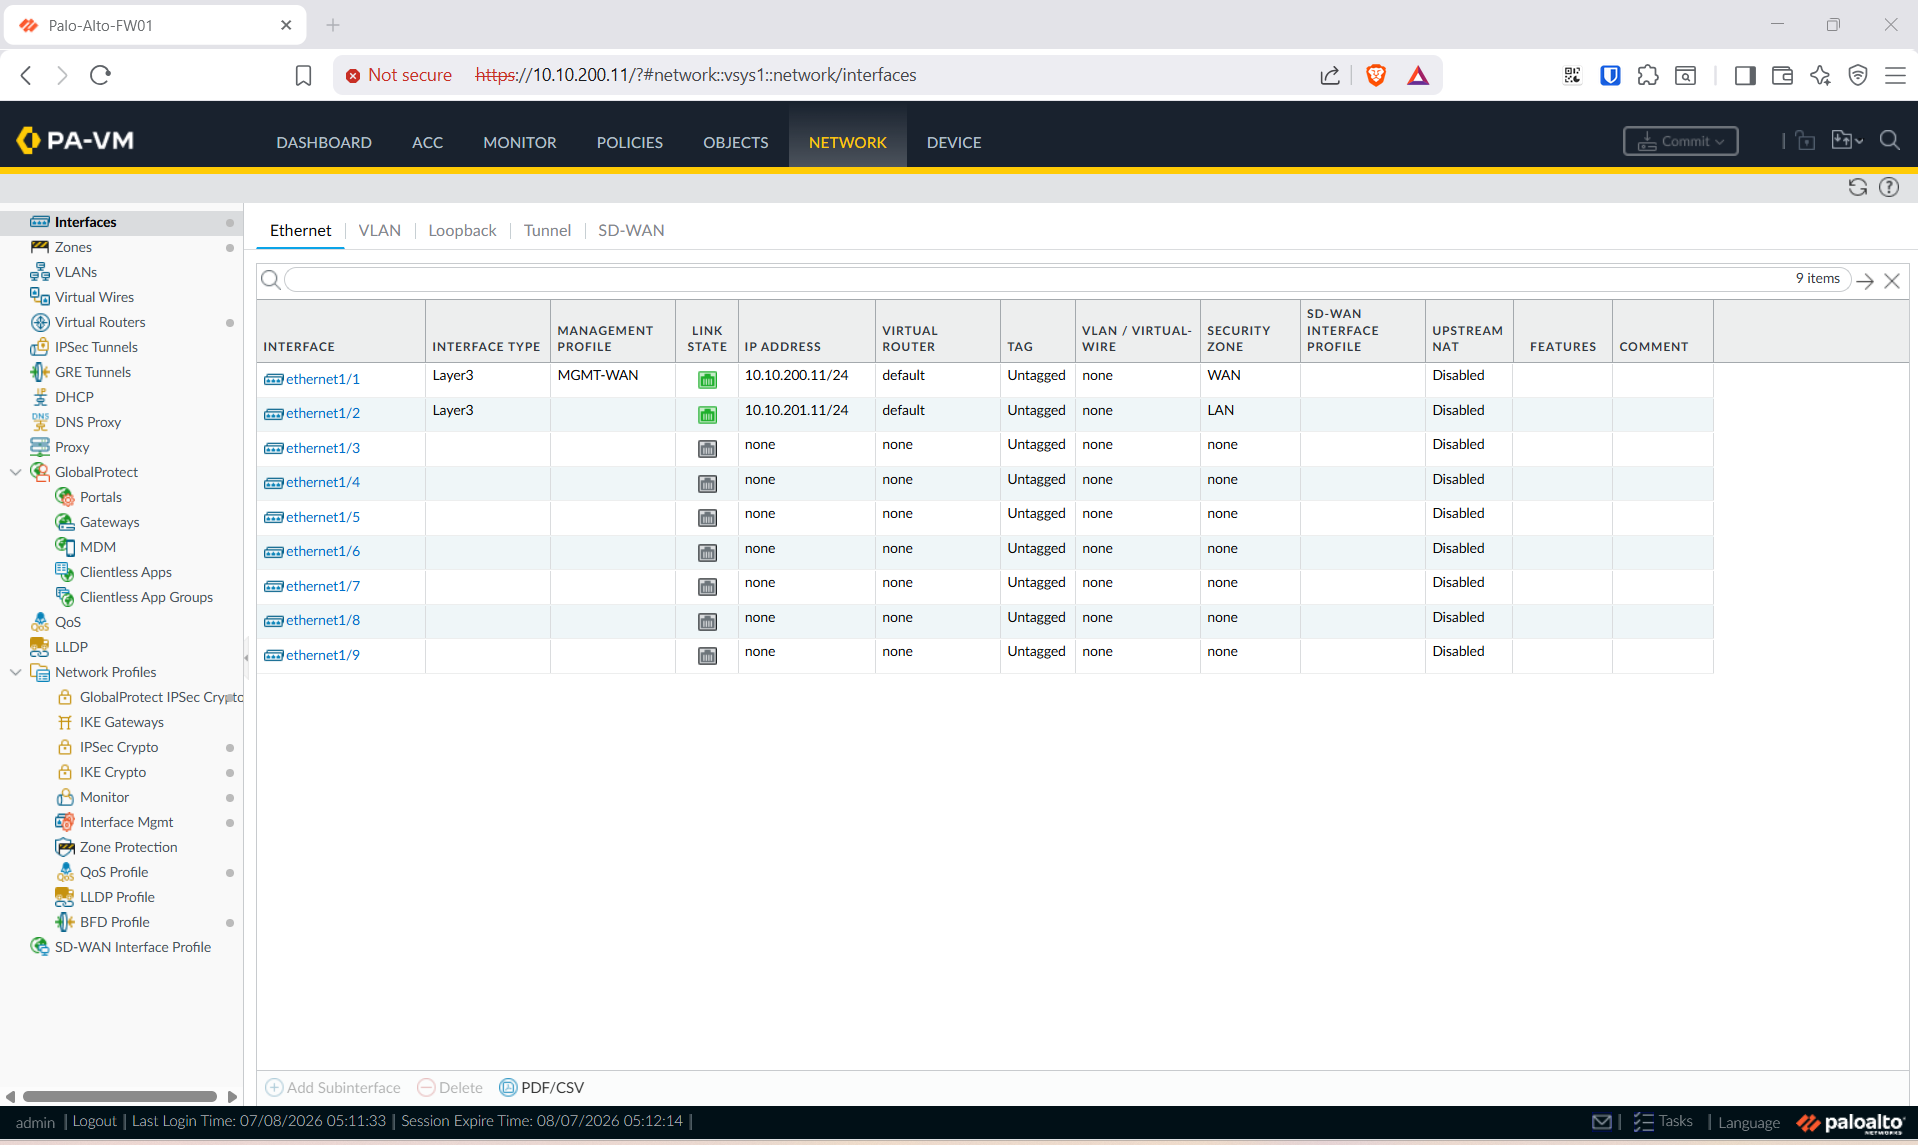
Kết quả mong đợi: từ máy trong VLAN200 truy cập được:
- GUI:
https://10.10.200.11 - CLI:
ssh admin@10.10.200.11
Lưu ý:
interface ethernet ethernet1/1— chữethernet2 lần (loại + tên). Bật HTTPS/SSH trên WAN ngoài production là rủi ro; lab này WAN là VLAN200 nội bộ nên chấp nhận được, có thể siết bằngset network profiles interface-management-profile MGMT-WAN permitted-ip 172.16.10.0/24.
Step 1: Hoàn tất cấu hình PA qua SSH
Mục tiêu: security, NAT, SNMP, DNS, service routes. ssh admin@10.10.200.11 rồi paste:
configure

# Security policy cho LAN ra WAN
set rulebase security rules ALLOW-LAN-WAN from LAN to WAN source any destination any application any service any action allow

# Source NAT: LAN 10.10.201.0/24 ẩn sau IP WAN eth1/1 (gateway .1 NAT tiếp ra internet)
set rulebase nat rules LAN-to-WAN from LAN to WAN source 10.10.201.0/24 destination any service any to-interface ethernet1/1 source-translation dynamic-ip-and-port interface-address interface ethernet1/1

# Interface Mgmt Profile cho LAN: SNMP + HTTPS(API) + ping — Zabbix poll qua đây
set network profiles interface-management-profile MGMT-LAN snmp yes https yes ping yes
set network interface ethernet ethernet1/2 layer3 interface-management-profile MGMT-LAN

# SNMPv2c community
set deviceconfig system snmp-setting access-setting version v2c snmp-community-string Public

# DNS + service routes qua WAN (để PA resolve + tải EDL; mgmt plane không ra internet)
set deviceconfig system dns-setting servers primary 8.8.8.8 secondary 1.1.1.1
set deviceconfig system route service dns source interface ethernet1/1 address 10.10.200.11/24
set deviceconfig system route service edl-updates source interface ethernet1/1 address 10.10.200.11/24
set deviceconfig system route service paloalto-networks-services source interface ethernet1/1 address 10.10.200.11/24

commit
addresstrong service route phải kèm prefix/24— nó tham chiếu địa chỉ đã cấu hình trên interface, không phải IP trần. Mẹo tra tên service:set deviceconfig system route service ?.
Kết quả mong đợi: từ Ubuntu (sau khi cấu hình mạng ở Step 5) ping ra internet OK. Gateway cấm ICMP nên ping 8.8.8.8 sẽ mất gói — test bằng HTTP: curl -s -o /dev/null -w "%{http_code}\n" https://google.com → 200/301.
Step 2: Danh sách IP Việt Nam bằng EDL
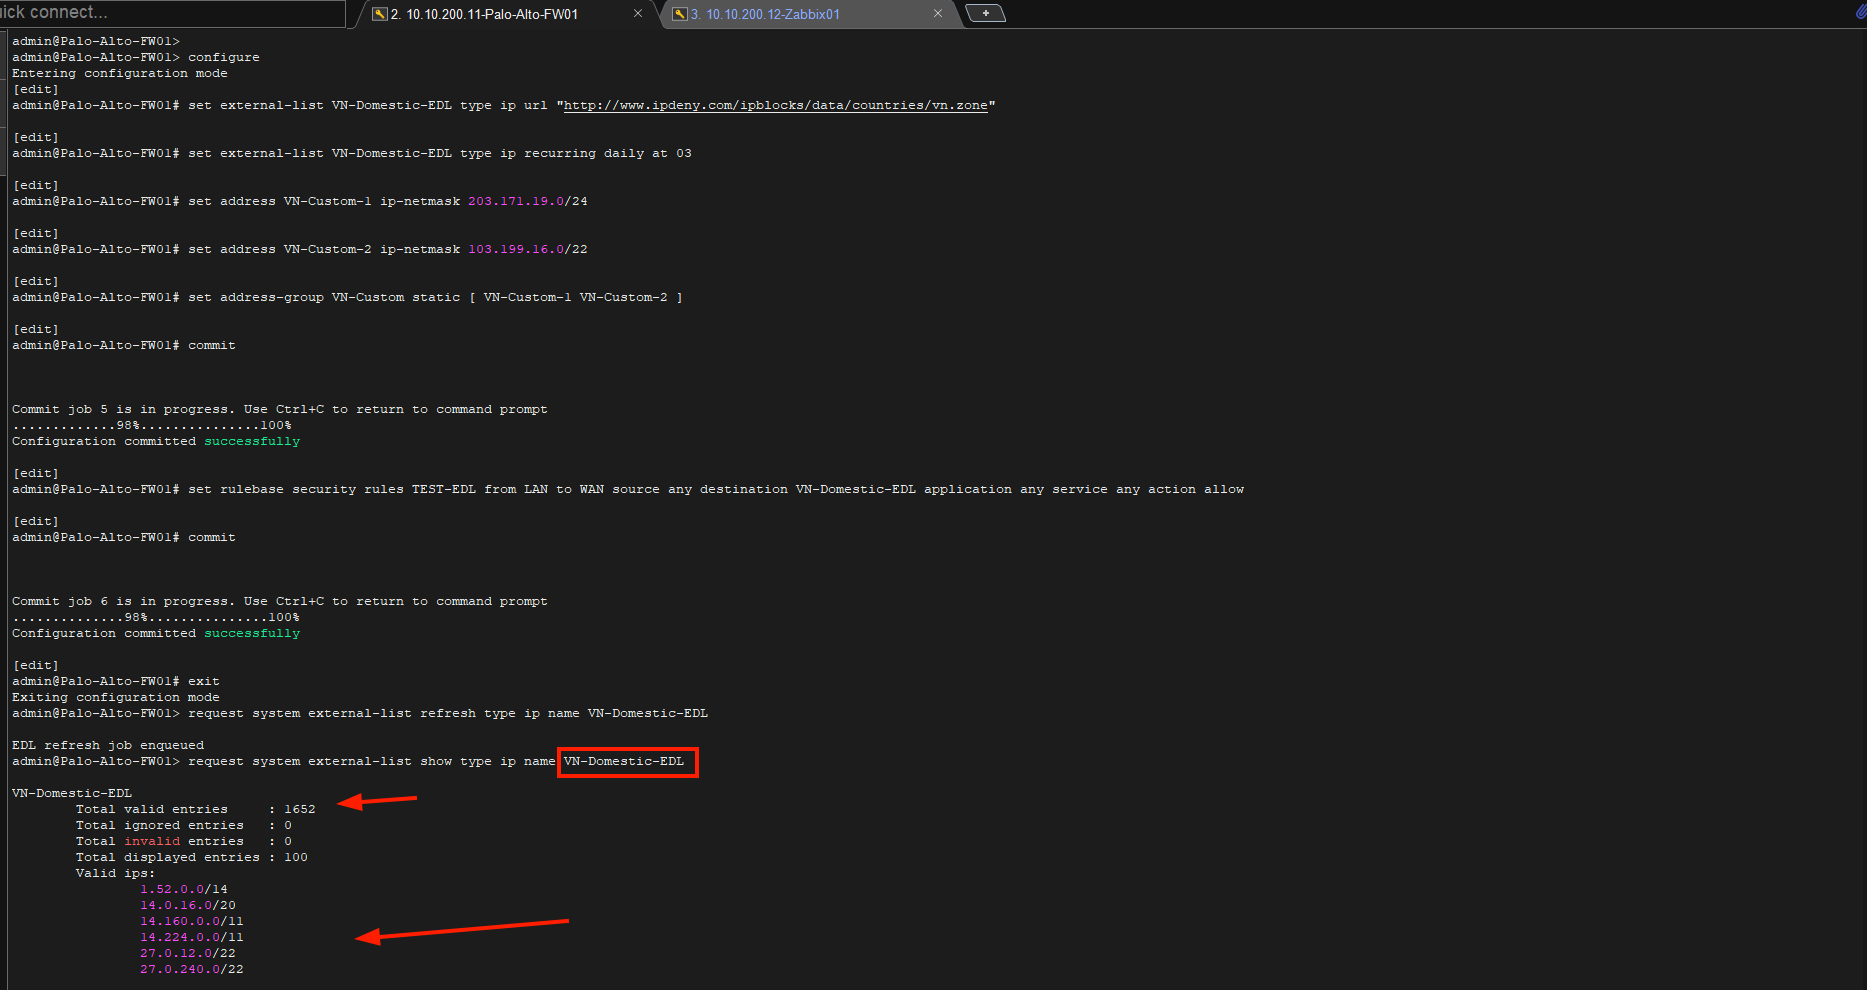
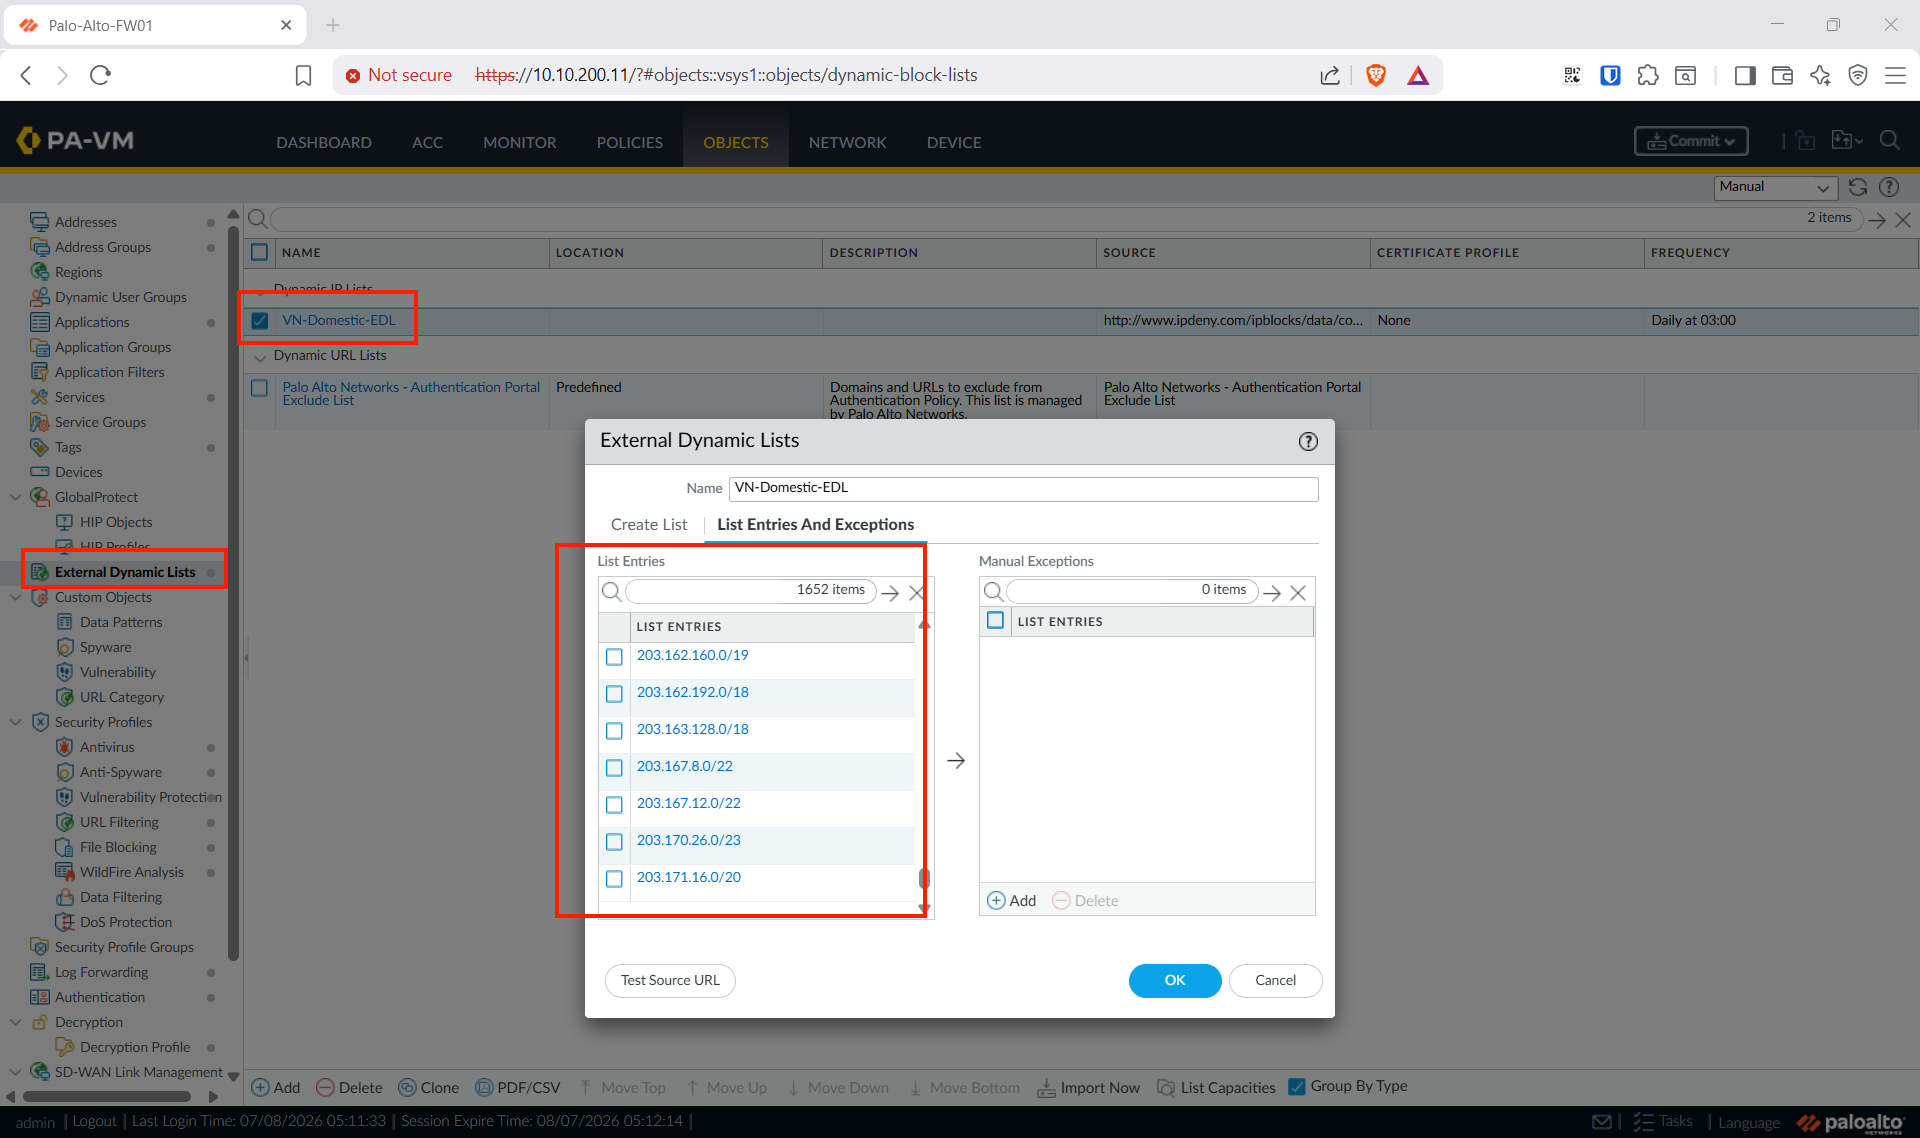
Mục tiêu: PA nhận diện IP Việt Nam để phân loại TN. Dùng External Dynamic List (EDL) trỏ danh sách CIDR VN công khai (ipdeny.com) — không cần license, tự cập nhật; kèm vài dải custom bổ sung.
configure

# EDL từ ipdeny (tự cập nhật hằng ngày). Dùng HTTP (80) né lỗi cert.
set external-list VN-Domestic-EDL type ip url "http://www.ipdeny.com/ipblocks/data/countries/vn.zone"
set external-list VN-Domestic-EDL type ip recurring daily at 03

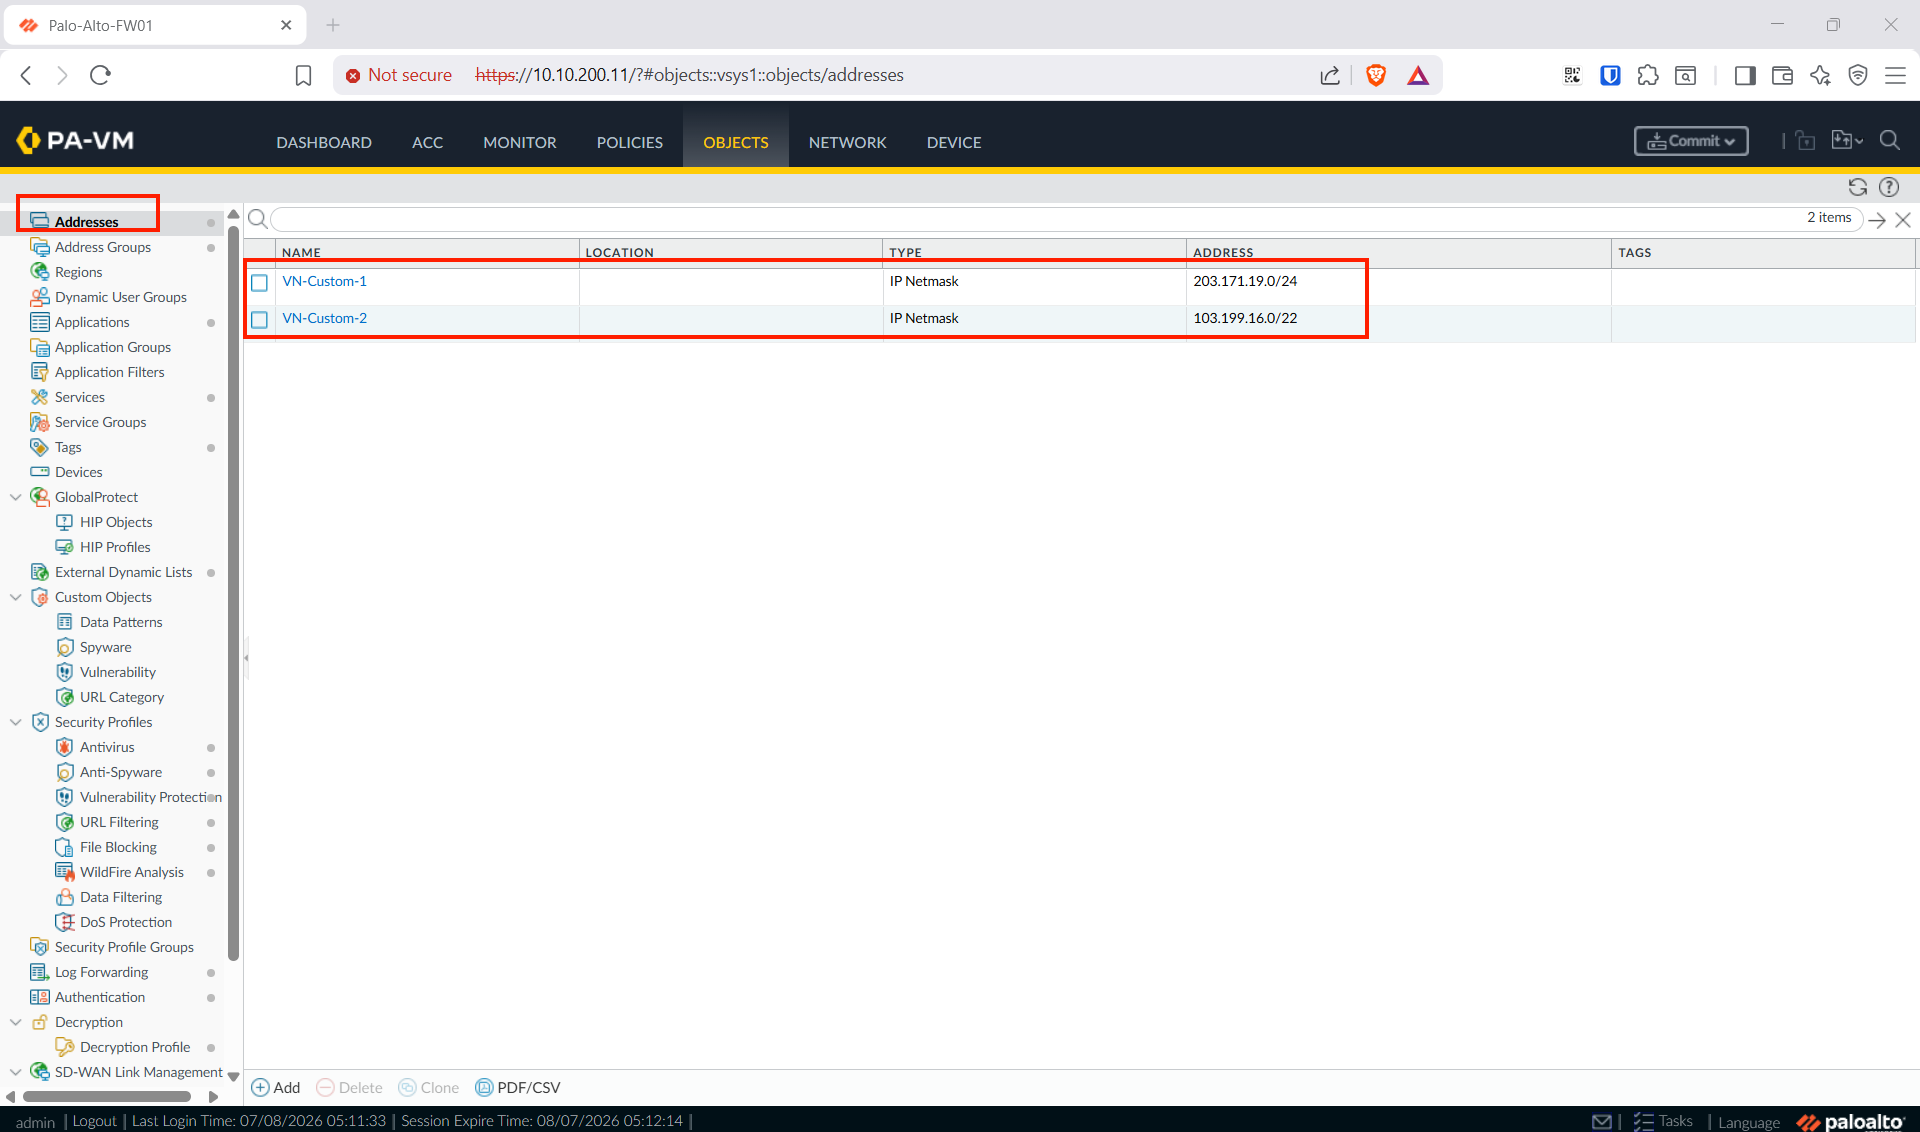
# Dải custom bổ sung (peering riêng / prefix chưa có trong ipdeny) — sửa theo thực tế
set address VN-Custom-1 ip-netmask 203.171.19.0/24
set address VN-Custom-2 ip-netmask 103.199.16.0/22
set address-group VN-Custom static [ VN-Custom-1 VN-Custom-2 ]

commit
Ép EDL tải về — PAN-OS chỉ tải EDL khi nó được tham chiếu trong policy. Sẽ dùng trong QoS ở Step 3; để test ngay có thể tạo rule tạm:
configure
set rulebase security rules TEST-EDL from LAN to WAN source any destination VN-Domestic-EDL application any service any action allow
commit
exit
request system external-list refresh type ip name VN-Domestic-EDL
request system external-list show type ip name VN-Domestic-EDL
Kết quả mong đợi: liệt kê hàng nghìn CIDR VN (1.52.0.0/14, 14.160.0.0/11, 27.64.0.0/12…) thay vì placeholder 0.0.0.0/32. Sau khi QoS đã tham chiếu EDL (Step 3), xóa rule tạm: delete rulebase security rules TEST-EDL.
Thêm range custom về sau: tạo thêm
set address VN-Custom-N ip-netmask <cidr>rồi thêm vào groupset address-group VN-Custom static [ ... ]. QoS đã trỏ tới group nên tự áp dụng sau khi commit.
Step 3: QoS phân loại TN và QT
Mục tiêu: PA gắn class 4 (TN) / class 5 (QT) cho traffic theo IP internet, ở cả 2 chiều để chắc chắn download được phân loại đúng.
Phần QoS làm bằng GUI cho chắc (CLI QoS PAN-OS nhiều tầng, dễ sai):
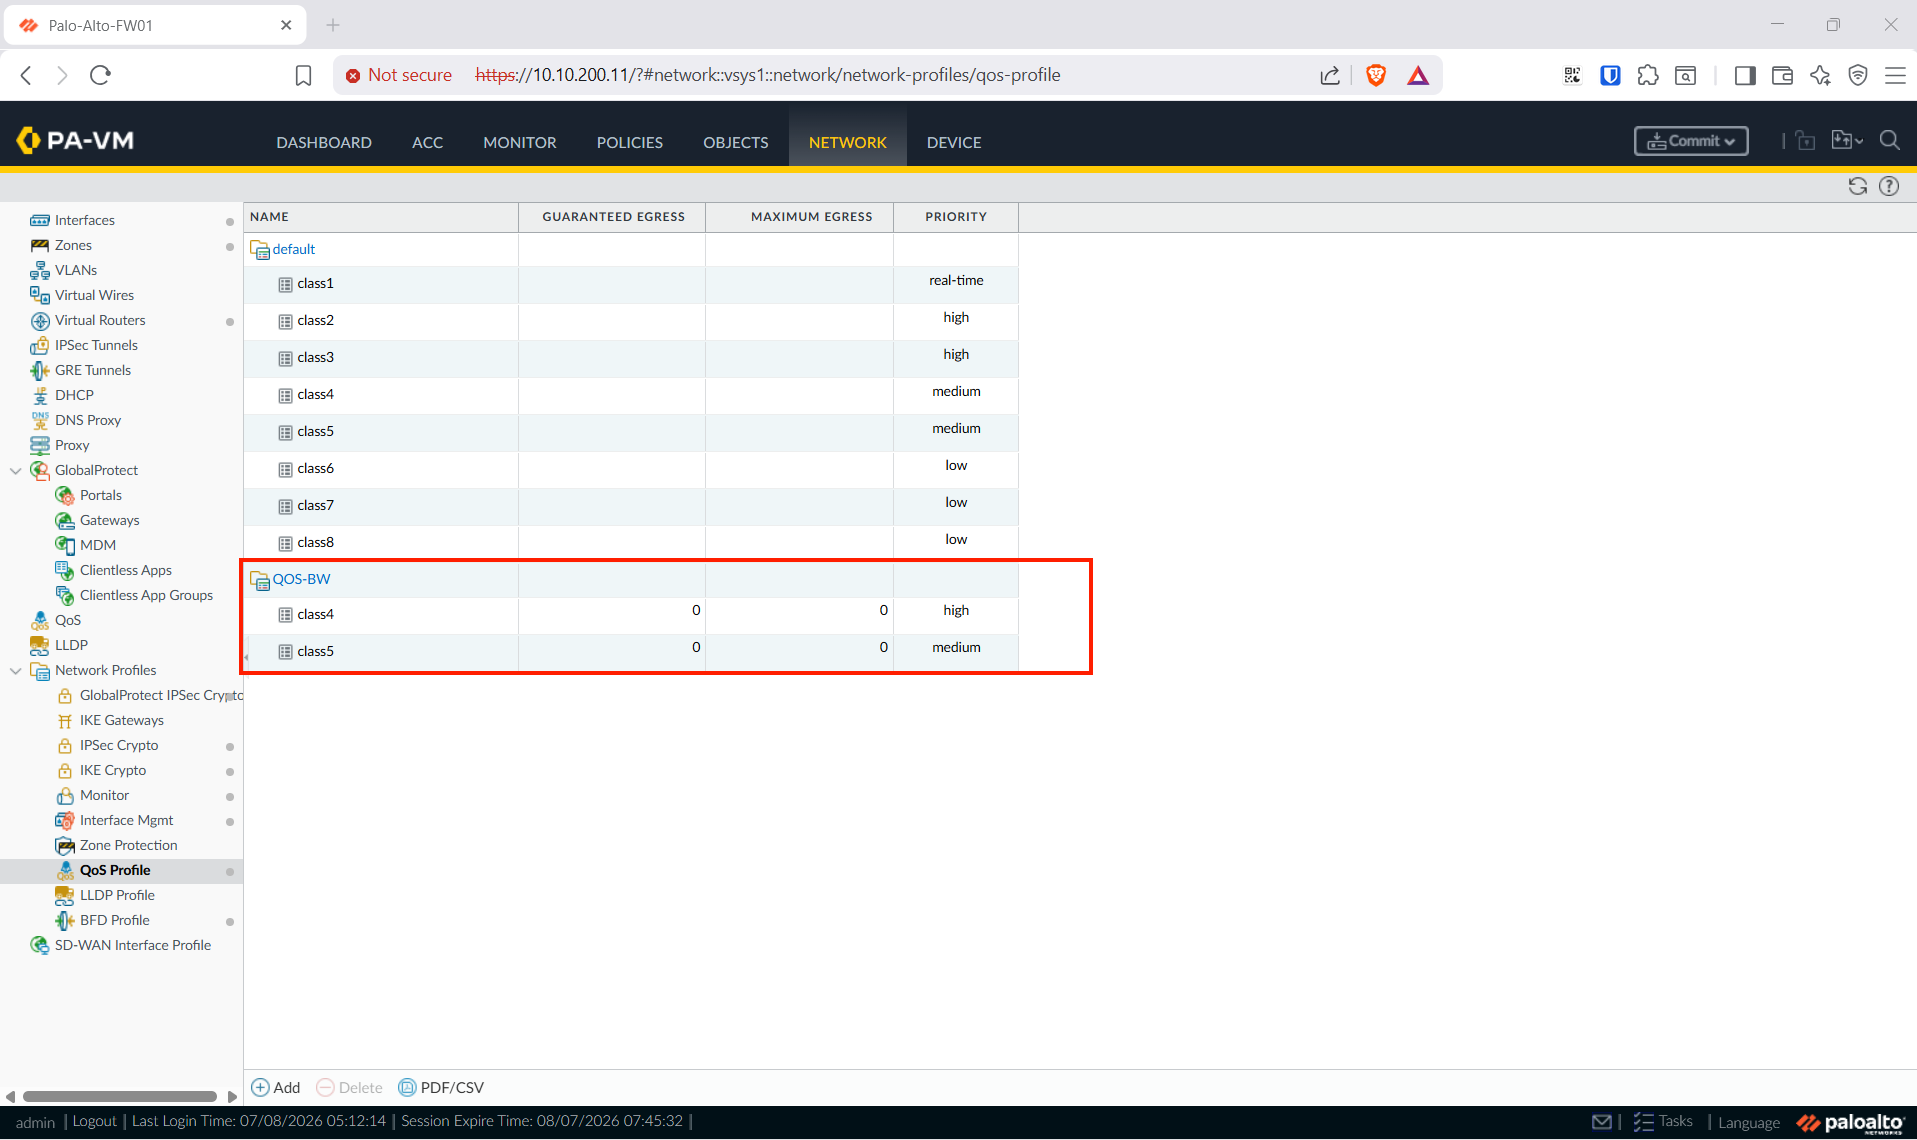
1. QoS Profile — Network → Network Profiles → QoS Profile → Add:
- Name
QOS-BW. Egress Max để0= unlimited — lab chỉ ĐO, không bóp băng thông. -
Thêm Class 4 Priority
High, Class 5 PriorityMedium; Egress Max mỗi class cũng để0.Egress Max chỉ tác dụng khi BÓP (drop/queue lúc vượt trần). Để
0= unlimited → không bóp gì, throughput đo ra vẫn chính xác. Đặt số cụ thể (vd1000) hay0đều cho kết quả đo y hệt — chỉ khác khi bạn thực sự muốn PA giới hạn băng thông (vd chặn QT vượt cước hợp đồng ISP thì đặt = tốc độ link WAN thật). Với mục tiêu giám sát, để0là gọn nhất.
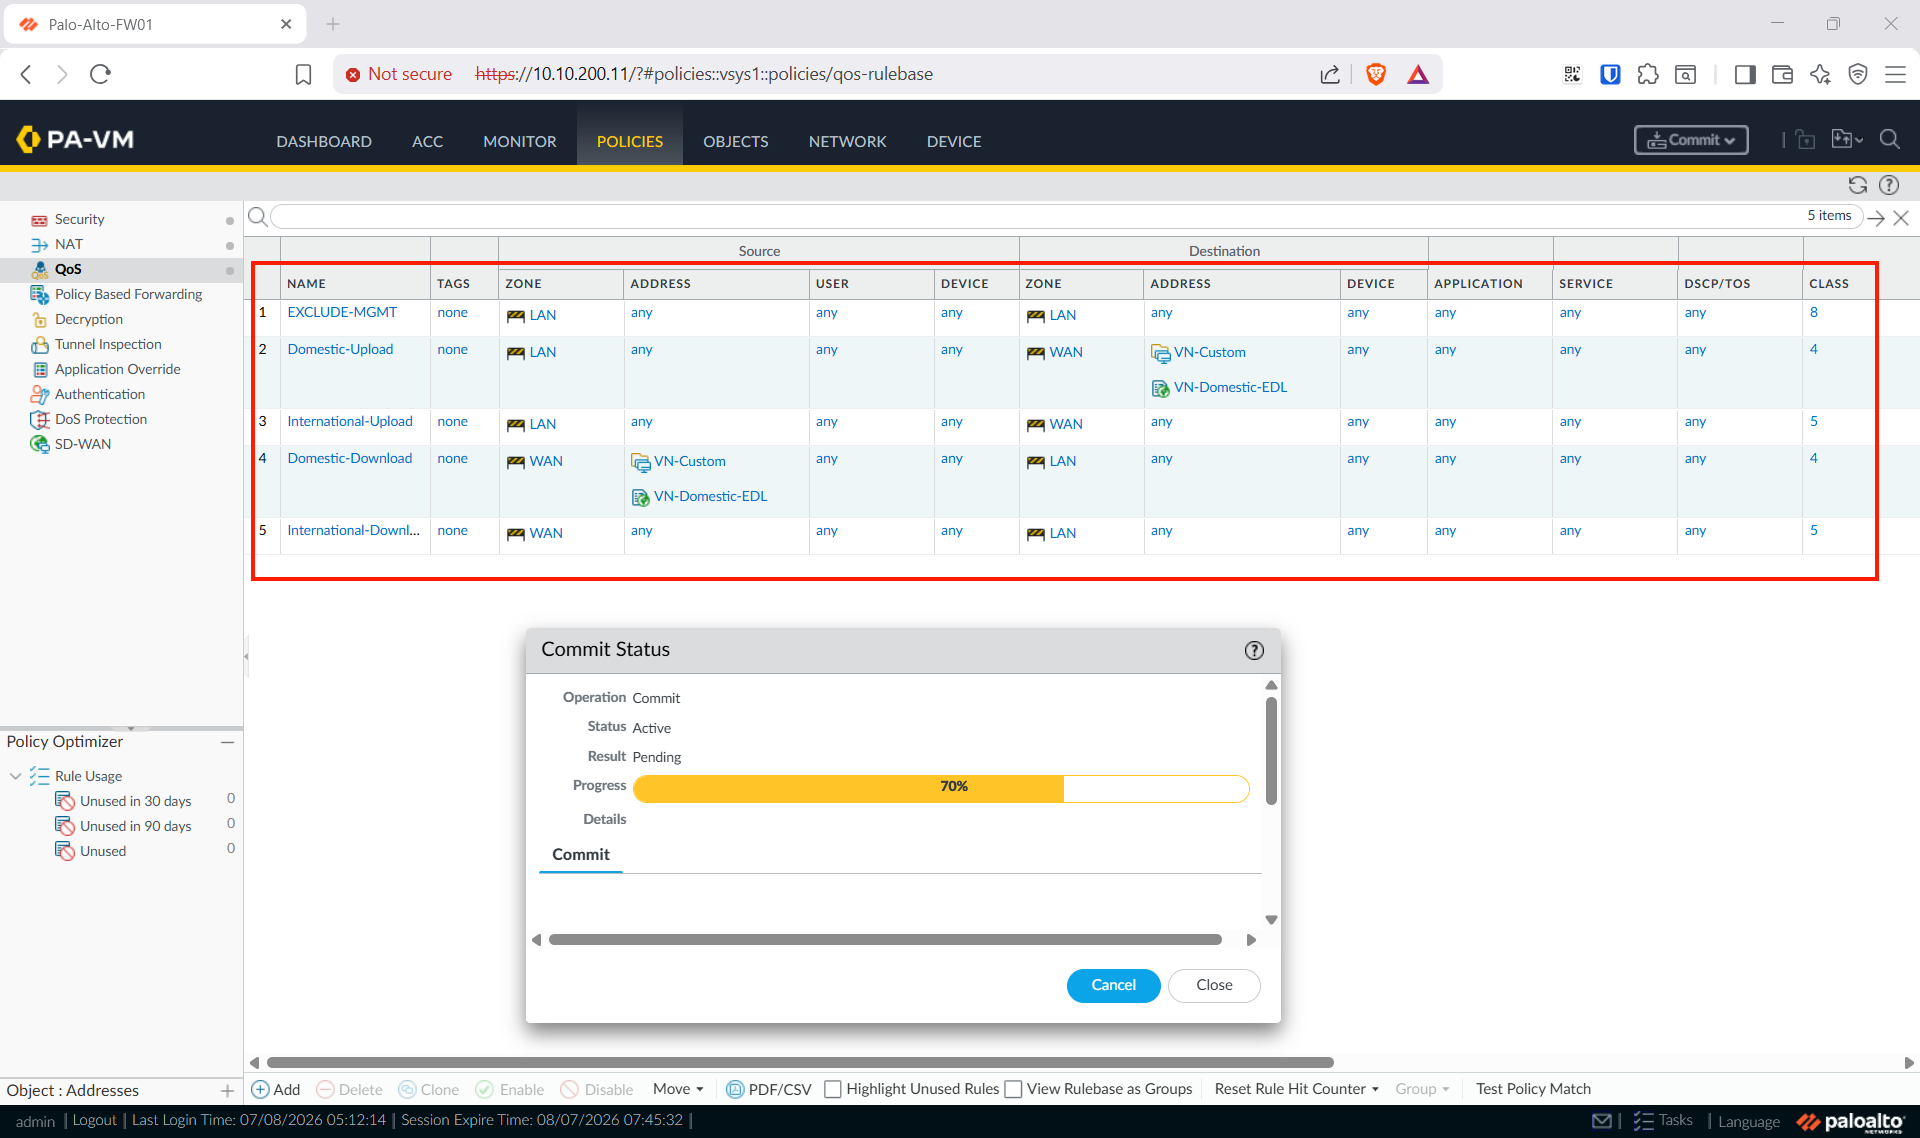
2. QoS Policy — Policies → QoS → Add (5 rule, thứ tự như dưới):
| # | Name | Source Zone | Source Addr | Dest Zone | Dest Addr | Class | Chiều / Giải thích |
|---|---|---|---|---|---|---|---|
| 1 | EXCLUDE-MGMT |
LAN | any | LAN | any | 8 | — Loại trừ traffic quản lý (LAN↔LAN), không đo |
| 2 | Domestic-Upload |
LAN | any | WAN | VN-Domestic-EDL, VN-Custom |
4 | ⬆️ Upload (LAN→WAN) — đích là IP VN |
| 3 | International-Upload |
LAN | any | WAN | any | 5 | ⬆️ Upload (LAN→WAN) — đích là IP còn lại |
| 4 | Domestic-Download |
WAN | VN-Domestic-EDL, VN-Custom |
LAN | any | 4 | ⬇️ Download (WAN→LAN) — nguồn là IP VN |
| 5 | International-Download |
WAN | any | LAN | any | 5 | ⬇️ Download (WAN→LAN) — nguồn là IP còn lại |
Mỗi rule bấm Add rồi điền theo tab (các cột trên ↔ tab GUI):
| Cột trong bảng | Tab trong dialog |
|---|---|
| Name | General |
| Source Zone / Source Addr | Source (Zone: bấm Add chọn LAN/WAN; Address: bỏ tick Any rồi Add object) |
| Dest Zone / Dest Addr | Destination (tương tự) |
| Class | Other Settings → mục QoS → Class ⭐ |
Tab Application và Service/URL Category để any (mặc định). Address để Any trừ rule 2 và 4 (chọn VN-Domestic-EDL + VN-Custom).
Chiều upload (LAN→WAN): IP internet là Destination → match dest. Chiều download (WAN→LAN): IP internet là Source → match source. Có đủ 4 rule TN/QT thì cả 2 chiều đều phân loại đúng.
Rule
EXCLUDE-MGMT(class 8) rất quan trọng: PA có default class = class 4 — mọi traffic không khớp rule nào sẽ rơi vào class 4 (= TN). Traffic Zabbix poll PA (SNMP + API) là LAN → LAN (Ubuntu ↔ IP LAN của PA), không khớp rule phân loại nào → nếu không có rule này sẽ chui vào class 4 làm TN luôn hiện ~500 kb/s dù không có download. Đưa nó vào class 8 (không đo) để TN sạch.
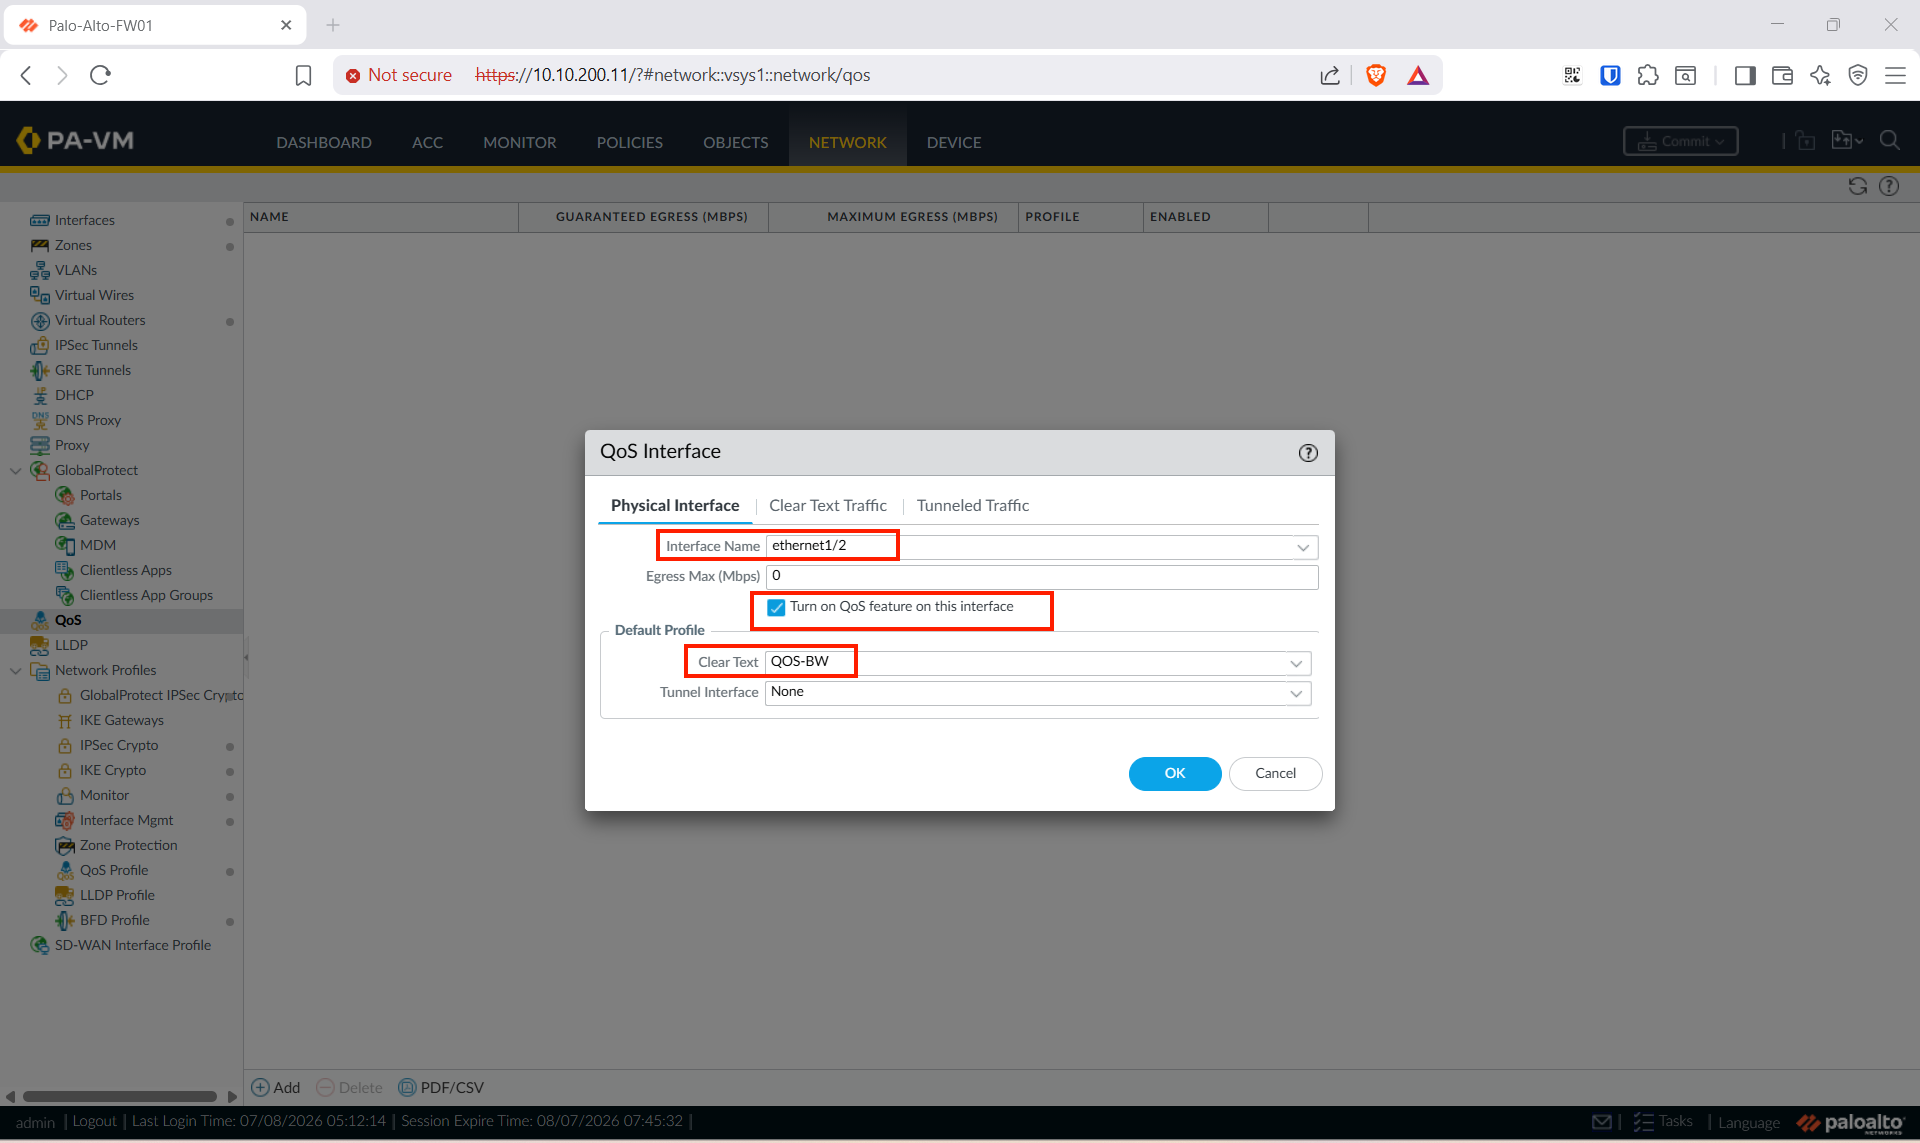
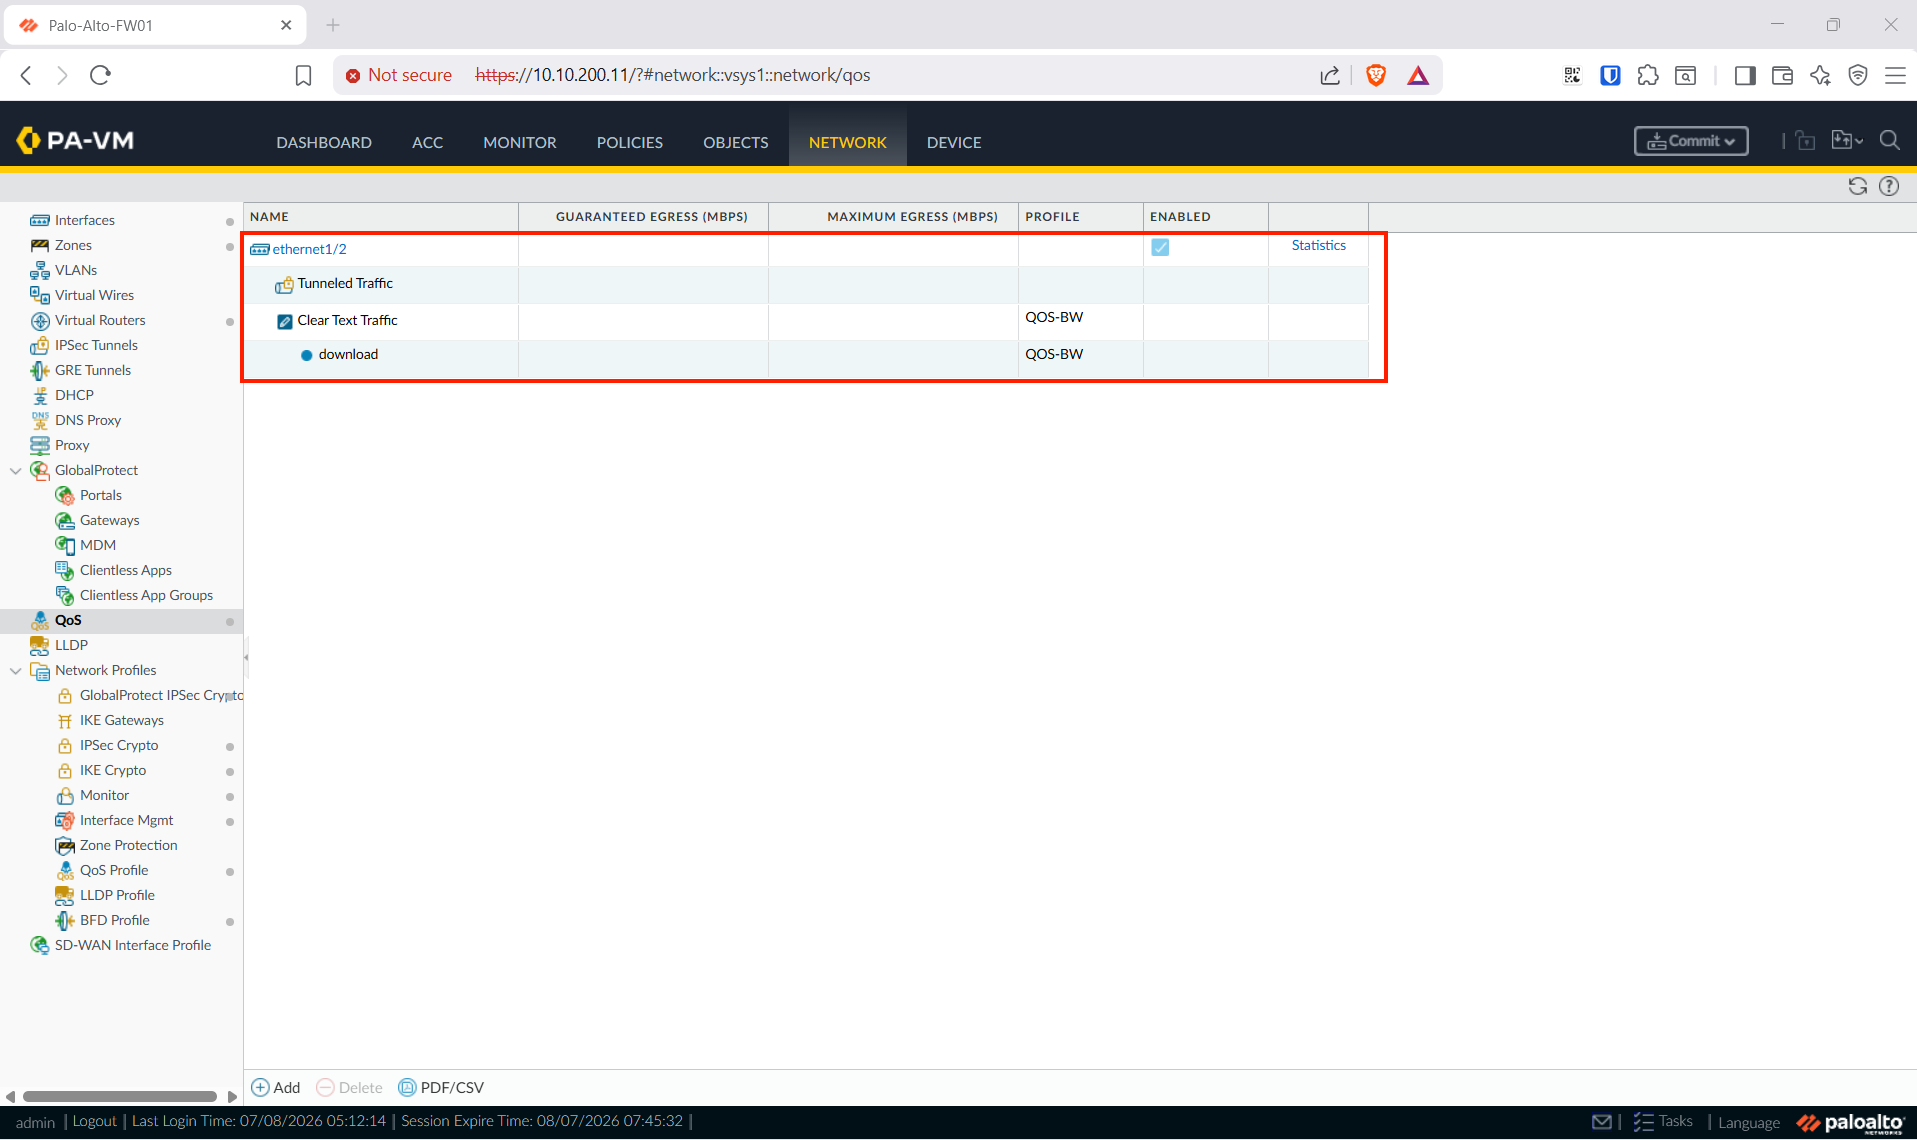
3. Bật QoS trên interface ethernet1/2 (nơi download đi ra) — Network → QoS → Add:
- Tab Physical Interface: Interface Name
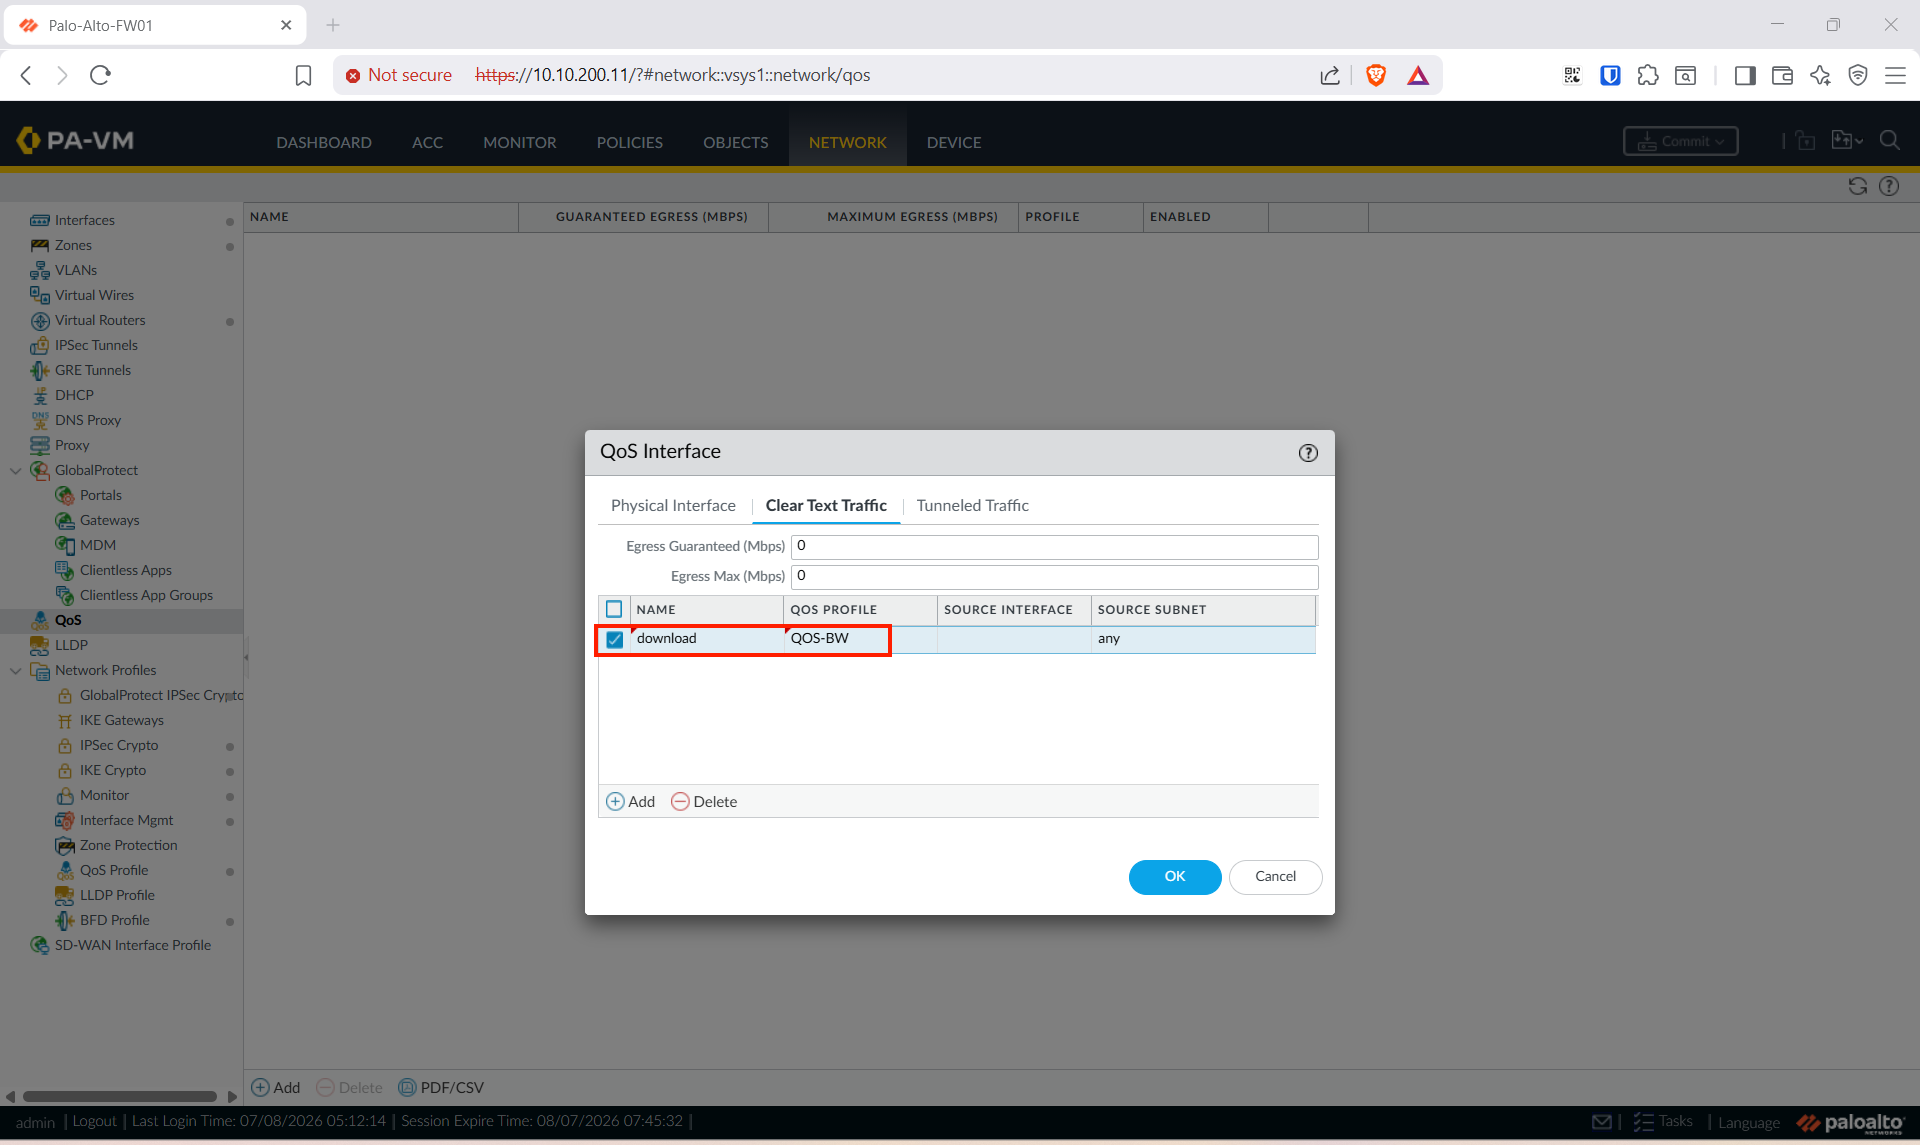
ethernet1/2· Egress Max0· tick Turn on QoS feature · Default Profile → Clear Text =QOS-BW· Tunnel InterfaceNone. - Tab Clear Text Traffic: Egress Guaranteed/Max =
0→ bấm Add tạo 1 node: Namedownload, QoS ProfileQOS-BW, Source Subnetany.
⭐ Tên node
downloadchính là node đọc throughput — nó thành Qid 1, lệnh đọcthroughput 1sẽ trảclass 4/5từ node này. Không tạo node clear-text → chỉ códefault-group(Qid 0) trả số không sạch.Chỉ bật QoS trên
ethernet1/2— Total (eth1/1) lấy từ SNMP chứ không phải QoS, nên không cần bật QoS trên eth1/1.
Commit.
Kết quả mong đợi: khi có traffic, Network → QoS → Statistics trên ethernet1/2 thấy class 4 chạy khi tải site VN, class 5 khi tải quốc tế.
Step 4: API key và lệnh đọc throughput
Mục tiêu: lấy API key + chốt lệnh đọc throughput download (node của eth1/2). Chạy từ Ubuntu (sau Step 5) hoặc bất kỳ máy nào tới được 10.10.201.11.
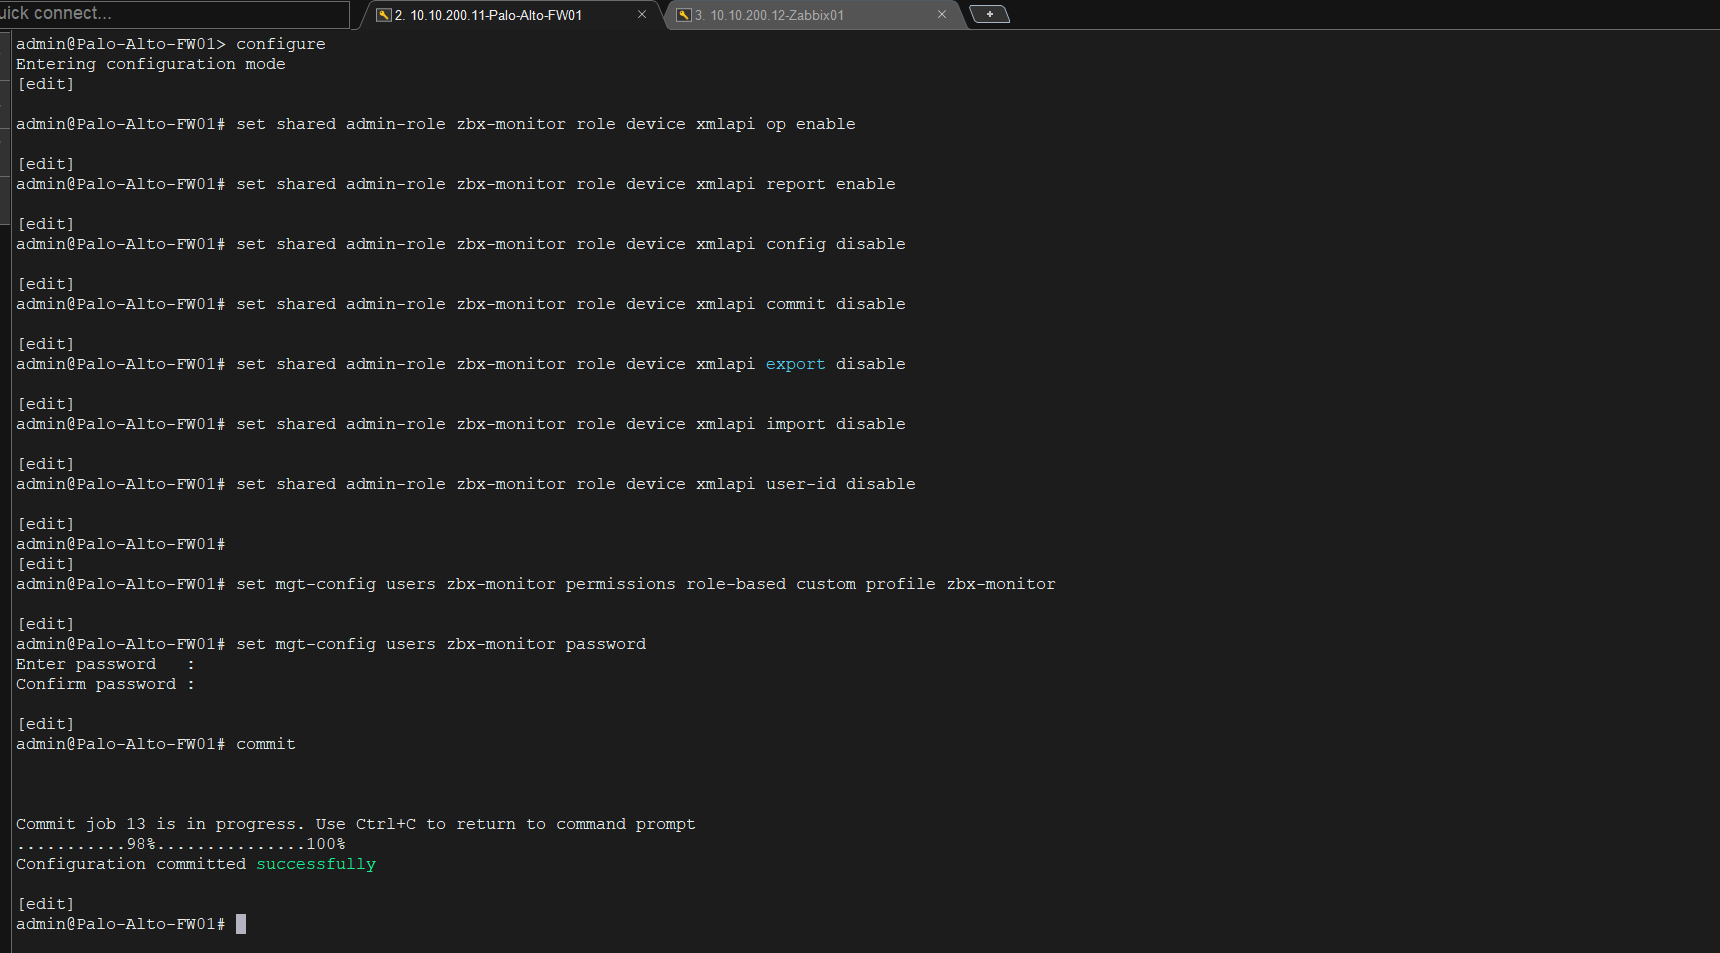
1. Tạo user giám sát riêng — KHÔNG dùng admin. API key nằm trong config Zabbix dạng gần plaintext; nếu rò rỉ, user quyền tối thiểu chỉ đọc được QoS, không sửa được firewall. Lệnh đọc throughput là operational command nên chỉ cần bật XML API → Operational Requests, cấm hết config/commit/import/export. Chạy trên PA:
configure

# Admin role: chỉ cho XML API operational + report, cấm sửa
set shared admin-role zbx-monitor role device xmlapi op enable
set shared admin-role zbx-monitor role device xmlapi report enable
set shared admin-role zbx-monitor role device xmlapi config disable
set shared admin-role zbx-monitor role device xmlapi commit disable
set shared admin-role zbx-monitor role device xmlapi export disable
set shared admin-role zbx-monitor role device xmlapi import disable
set shared admin-role zbx-monitor role device xmlapi user-id disable

# User gán role đó
set mgt-config users zbx-monitor permissions role-based custom profile zbx-monitor
set mgt-config users zbx-monitor password
# → nhập password khi được hỏi: Zxcasd123!@#

commit
exit
keygenkhông bị role chặn — mọi account đăng nhập được đều sinh key. Role chỉ giới hạn key gọi được lệnh gì: với config trên, key chỉ chạy op command (đọc), không sửa/commit được.
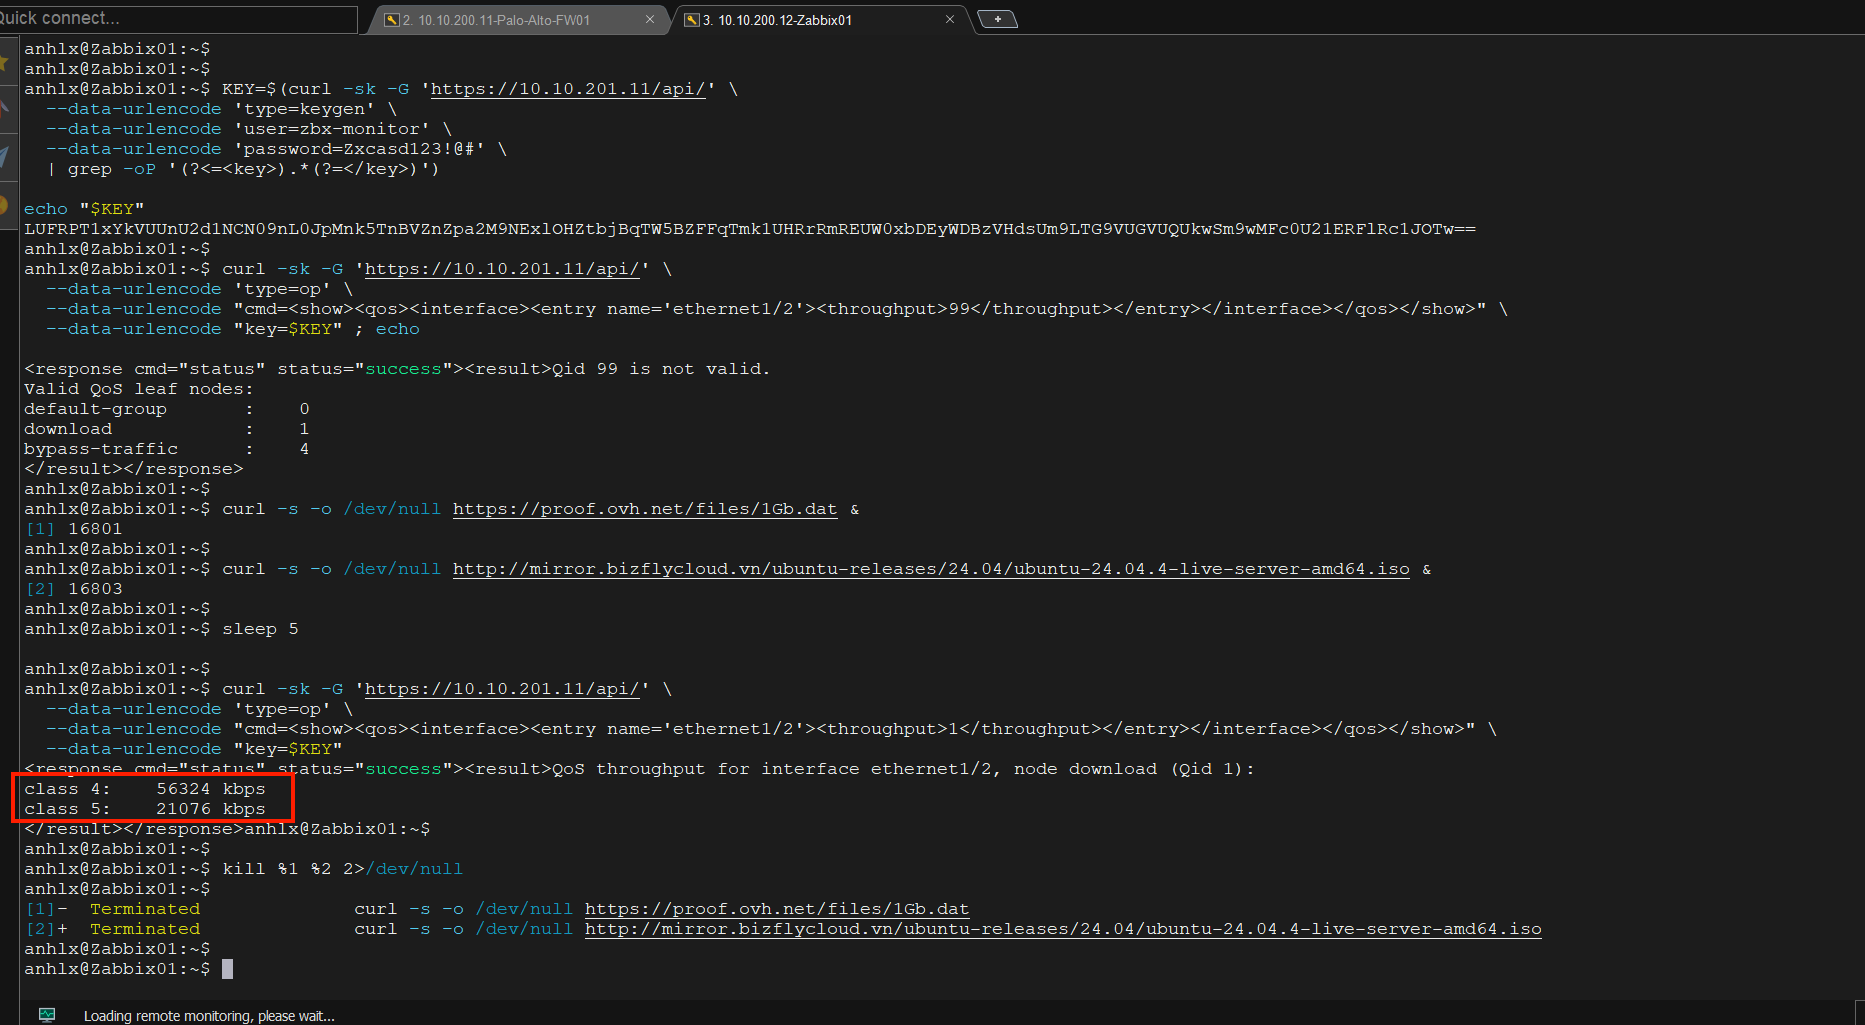
2. Sinh API key — dùng -G --data-urlencode để encode password đúng :
KEY=$(curl -sk -G 'https://10.10.201.11/api/' \
  --data-urlencode 'type=keygen' \
  --data-urlencode 'user=zbx-monitor' \
  --data-urlencode 'password=Zxcasd123!@#' \
  | grep -oP '(?<=<key>).*(?=</key>)')

echo "$KEY"
3. Xác định node QoS của eth1/2. Số sau throughput là Qid (queue node), không phải số class. Liệt kê node:
curl -sk -G 'https://10.10.201.11/api/' \
  --data-urlencode 'type=op' \
  --data-urlencode "cmd=<show><qos><interface><entry name='ethernet1/2'><throughput>99</throughput></entry></interface></qos></show>" \
  --data-urlencode "key=$KEY" ; echo
# → liệt kê node hợp lệ, thường node "download" = Qid 1
4. Đọc throughput node download — 1 call ra cả 2 class. Sinh traffic 2 chiều rồi đọc; cả 2 curl phải cùng chạy lúc poll mới thấy đủ 2 class → chạy nền (&) cả hai, sleep cho traffic ramp, đọc, rồi kill dọn nền:
curl -s -o /dev/null https://proof.ovh.net/files/1Gb.dat &                                                     # QT → class 5
curl -s -o /dev/null http://mirror.bizflycloud.vn/ubuntu-releases/24.04/ubuntu-24.04.4-live-server-amd64.iso &  # TN → class 4
sleep 5   # chờ traffic tăng tốc

curl -sk -G 'https://10.10.201.11/api/' \
  --data-urlencode 'type=op' \
  --data-urlencode "cmd=<show><qos><interface><entry name='ethernet1/2'><throughput>1</throughput></entry></interface></qos></show>" \
  --data-urlencode "key=$KEY"

kill %1 %2 2>/dev/null   # dừng 2 curl nền
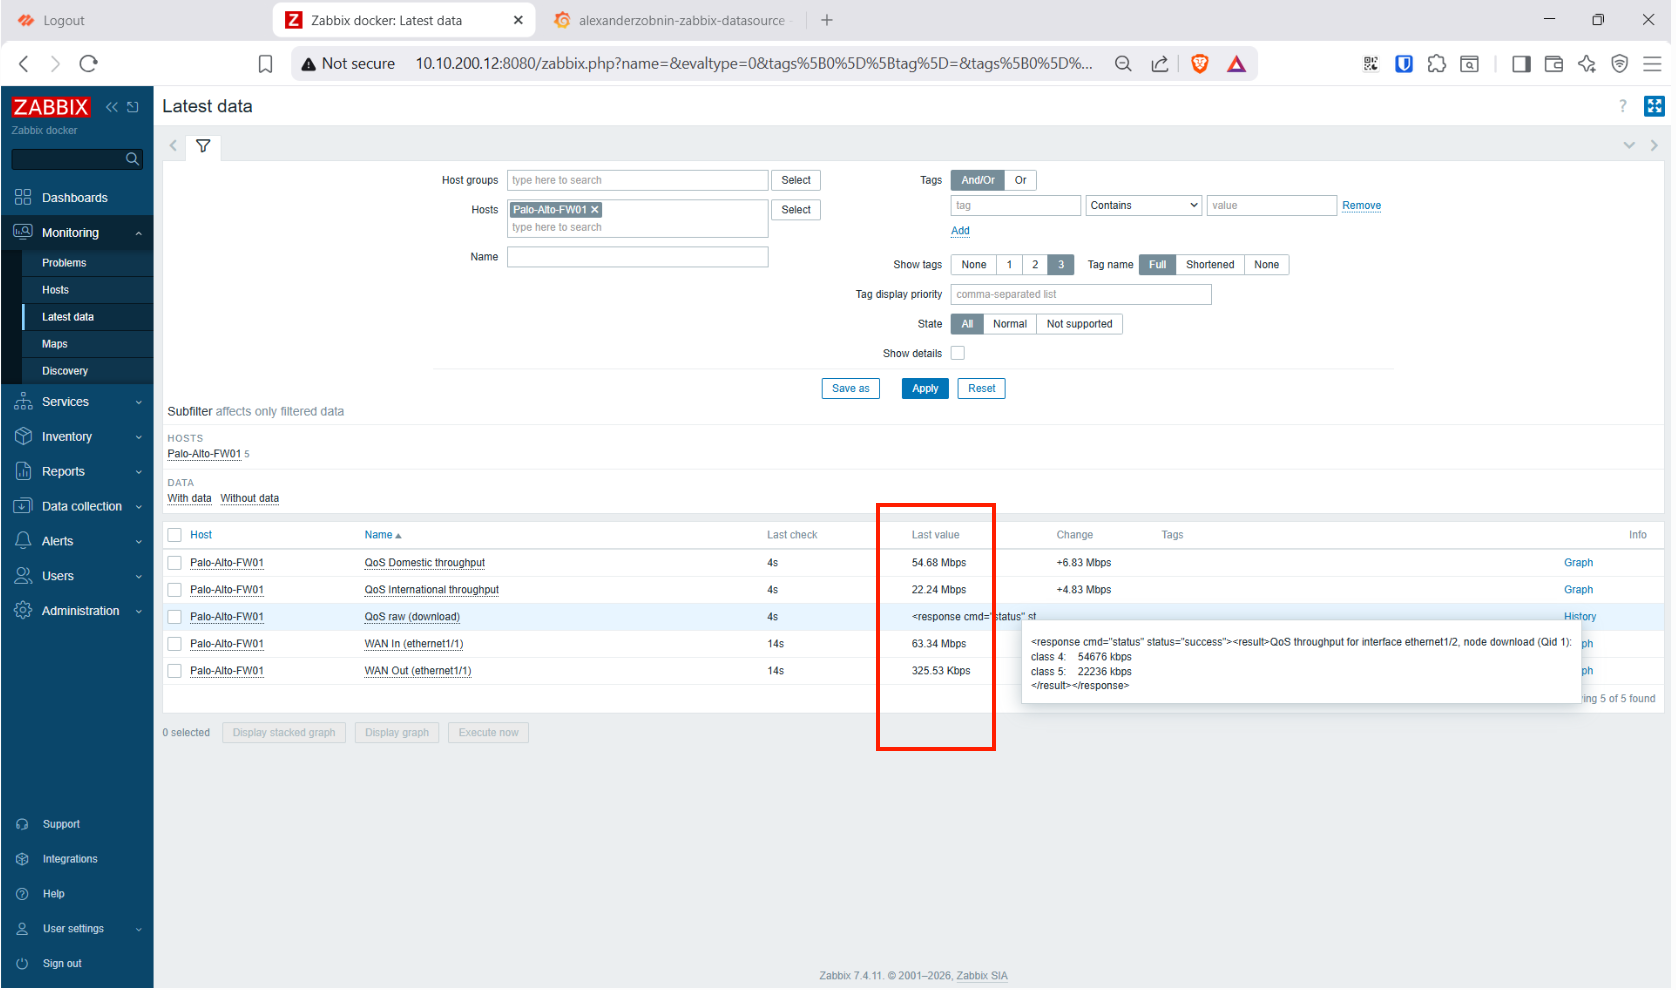
Kết quả mong đợi — response là CDATA text, cả TN lẫn QT cùng lúc:
<response cmd="status" status="success"><result>QoS throughput for interface ethernet1/2, node download (Qid 1):
class 4:    50612 kbps
class 5:    15332 kbps
</result></response>
class 4= TN download (IP nguồn ∈ VN),class 5= QT download.- Lúc không có traffic in ra
no traffic passed.hoặc bỏ dòng class = 0 → Zabbix xử lý bằng “custom on fail = 0”.
Response là CDATA text nên Zabbix parse bằng Regular expression (không phải XPath):
class 4:\s+(\d+)\s+kbpscho TN,class 5:\s+(\d+)\s+kbpscho QT. Nếu node/Qid của bạn khác, dùng lệnh ở bước 3 để lấy đúng số. Muốn xem gọn ngay trên terminal, nối thêm| grep -oE 'class [0-9]+:[[:space:]]*[0-9]+ kbps'.
Step 5: Cấu hình mạng Ubuntu và cài Docker
Mục tiêu: Ubuntu dual-homed — quản trị (SSH/web) vào qua VLAN200, còn traffic ra internet đi qua PA (VLAN201) để QoS phân loại. Đây là bài toán policy routing.
0. Đặt hostname:
sudo hostnamectl set-hostname Zabbix01
echo "127.0.1.1 Zabbix01" | sudo tee -a /etc/hosts
1. Netplan — traffic mặc định qua PA 10.10.201.11; reply cho SSH/web (source 10.10.200.12) và cho subnet laptop 172.16.10.0/24 đi ngược ra gateway VLAN200 10.10.200.1:
ls /etc/netplan/                                   # xem file hiện có
echo "network: {config: disabled}" | sudo tee /etc/cloud/cloud.cfg.d/99-disable-network-config.cfg
sudo rm -f /etc/netplan/50-cloud-init.yaml         # tránh trùng default route

sudo tee /etc/netplan/50-lab.yaml > /dev/null << 'EOF'
network:
  version: 2
  ethernets:
    ens160:                          # VLAN200 - quản trị
      addresses: [10.10.200.12/24]
      routing-policy:
        - from: 10.10.200.12
          table: 200
      routes:
        - to: 172.16.10.0/24         # subnet laptop -> gateway VLAN200
          via: 10.10.200.1
        - to: default
          via: 10.10.200.1
          table: 200
    ens192:                          # VLAN201 - traffic ra internet qua PA
      addresses: [10.10.201.12/24]
      routes:
        - to: default
          via: 10.10.201.11
      nameservers:
        addresses: [8.8.8.8, 1.1.1.1]
EOF
sudo chmod 600 /etc/netplan/50-lab.yaml
2. rp_filter = loose (bắt buộc, không thì inbound SSH bị drop do dual-home):
sudo tee /etc/sysctl.d/99-rpfilter.conf > /dev/null << 'EOF'
net.ipv4.conf.all.rp_filter=2
net.ipv4.conf.default.rp_filter=2
EOF
sudo sysctl --system
sudo netplan apply
3. Kiểm tra:
ip route                          # default via 10.10.201.11 dev ens192
ip route show table 200           # default via 10.10.200.1 dev ens160
curl -s -o /dev/null -w "%{http_code}\n" https://google.com   # 200/301 = internet qua PA OK
4. Cài Docker + Compose:
sudo apt update
sudo apt install -y ca-certificates curl gnupg
sudo install -m 0755 -d /etc/apt/keyrings
curl -fsSL https://download.docker.com/linux/ubuntu/gpg | sudo gpg --dearmor -o /etc/apt/keyrings/docker.gpg
sudo chmod a+r /etc/apt/keyrings/docker.gpg
echo "deb [arch=$(dpkg --print-architecture) signed-by=/etc/apt/keyrings/docker.gpg] https://download.docker.com/linux/ubuntu $(. /etc/os-release && echo $VERSION_CODENAME) stable" | sudo tee /etc/apt/sources.list.d/docker.list > /dev/null
sudo apt update
sudo apt install -y docker-ce docker-ce-cli containerd.io docker-buildx-plugin docker-compose-plugin
sudo docker --version && sudo docker compose version
apt install snmp -y
Vì sao policy routing: Ubuntu 2 NIC, default route qua PA (VLAN201) để traffic được QoS phân loại. Nhưng SSH/web tới
10.10.200.12(VLAN200) thì reply phải đi ngược ra10.10.200.1— nếu để default qua PA sẽ đứt session. Rulefrom 10.10.200.12 → bảng 200và route172.16.10.0/24 via 10.10.200.1(cho cả traffic container Docker) giải quyết việc này.
Step 6: Docker compose Zabbix, Postgres, Grafana
Mục tiêu: dựng stack giám sát trên Zabbix01.
mkdir -p ~/zbx-stack && cd ~/zbx-stack

cat > .env << 'EOF'
POSTGRES_USER=zabbix
POSTGRES_PASSWORD=Zxcasd123!@#
POSTGRES_DB=zabbix
GF_ADMIN_PASSWORD=Zxcasd123!@#
EOF

cat > docker-compose.yml << 'EOF'
services:
  postgres:
    image: postgres:16-alpine
    environment:
      POSTGRES_USER: ${POSTGRES_USER}
      POSTGRES_PASSWORD: ${POSTGRES_PASSWORD}
      POSTGRES_DB: ${POSTGRES_DB}
    volumes:
      - pgdata:/var/lib/postgresql/data
    restart: unless-stopped

  zabbix-server:
    image: zabbix/zabbix-server-pgsql:alpine-7.4-latest
    environment:
      DB_SERVER_HOST: postgres
      POSTGRES_USER: ${POSTGRES_USER}
      POSTGRES_PASSWORD: ${POSTGRES_PASSWORD}
      POSTGRES_DB: ${POSTGRES_DB}
    ports: ["10051:10051"]
    depends_on: [postgres]
    restart: unless-stopped

  zabbix-web:
    image: zabbix/zabbix-web-nginx-pgsql:alpine-7.4-latest
    environment:
      DB_SERVER_HOST: postgres
      POSTGRES_USER: ${POSTGRES_USER}
      POSTGRES_PASSWORD: ${POSTGRES_PASSWORD}
      POSTGRES_DB: ${POSTGRES_DB}
      ZBX_SERVER_HOST: zabbix-server
      PHP_TZ: Asia/Ho_Chi_Minh
    ports: ["8080:8080"]
    depends_on: [zabbix-server]
    restart: unless-stopped

  zabbix-agent:
    image: zabbix/zabbix-agent2:alpine-7.4-latest
    environment:
      ZBX_HOSTNAME: "Zabbix server"
      ZBX_SERVER_HOST: zabbix-server
    depends_on: [zabbix-server]
    restart: unless-stopped

  grafana:
    image: grafana/grafana-oss:latest
    environment:
      GF_SECURITY_ADMIN_PASSWORD: ${GF_ADMIN_PASSWORD}
      GF_INSTALL_PLUGINS: alexanderzobnin-zabbix-app,andrewbmchugh-flow-panel
    ports: ["3000:3000"]
    volumes: ["grafana:/var/lib/grafana"]
    depends_on: [zabbix-web]
    restart: unless-stopped

volumes:
  pgdata:
  grafana:
EOF

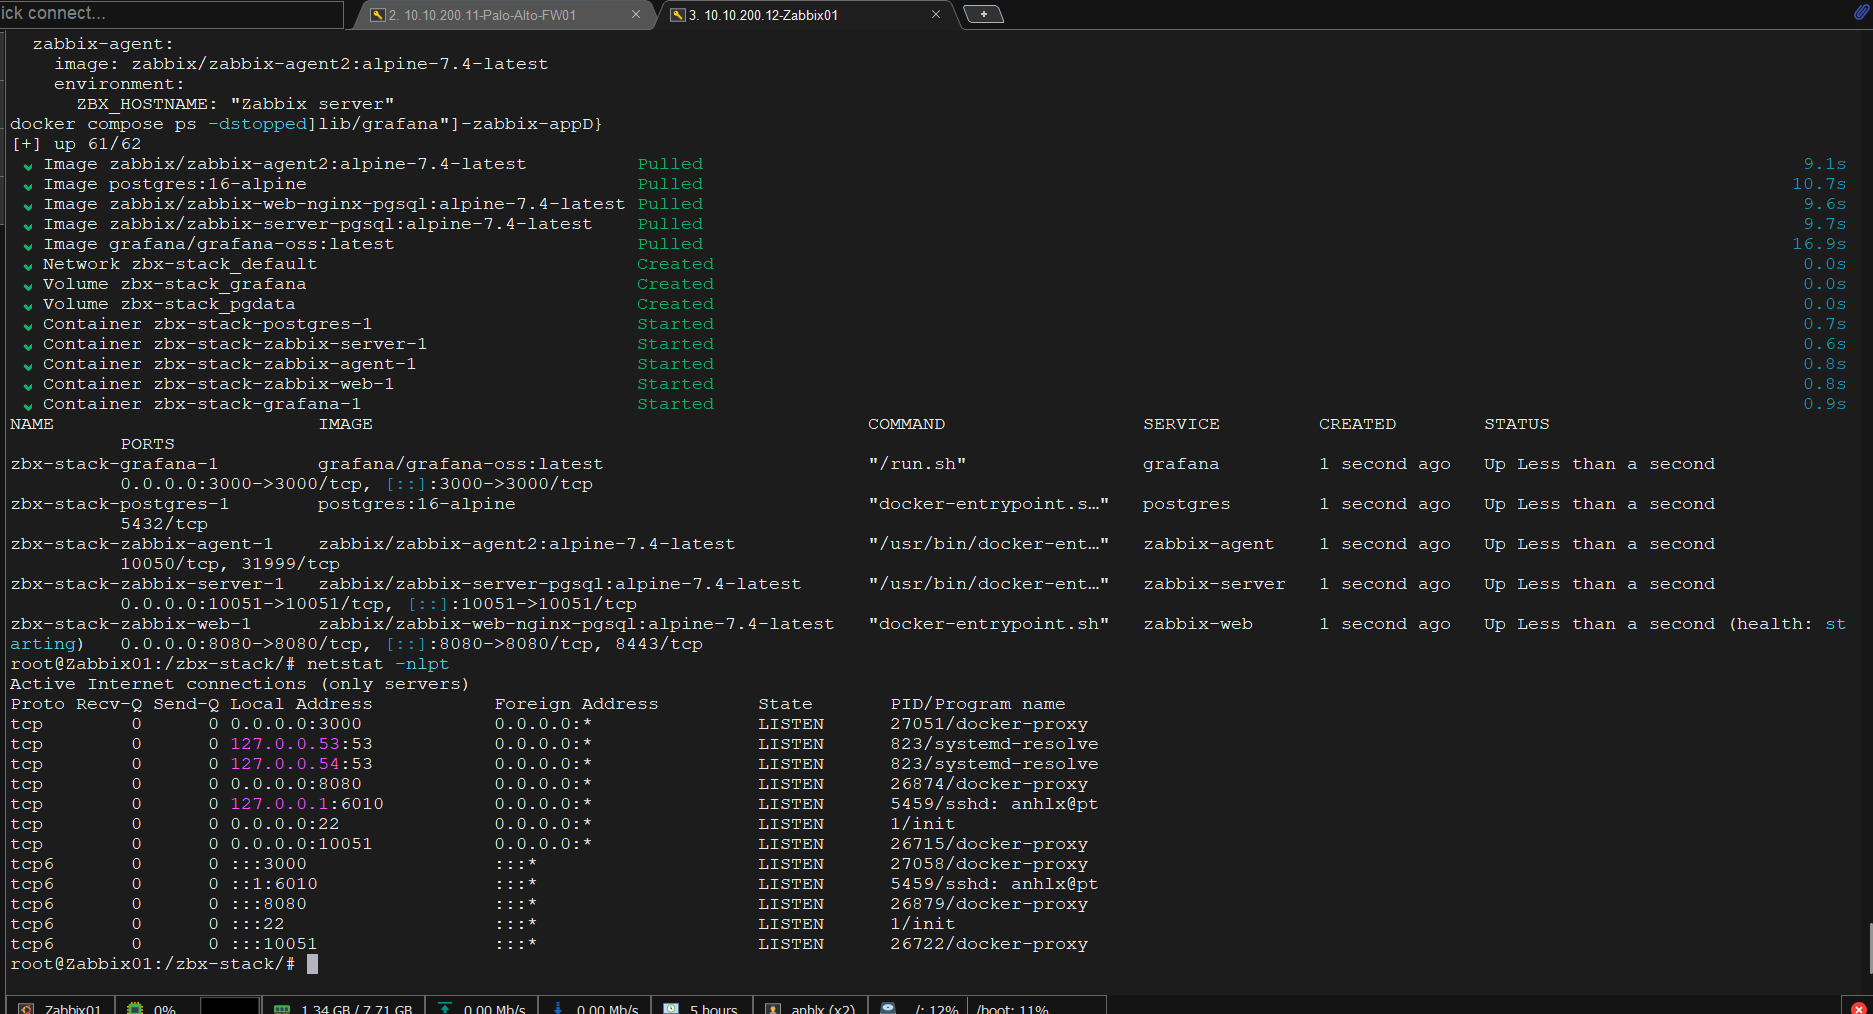
docker compose up -d
docker compose ps
Kết quả mong đợi: 5 container running. Truy cập từ laptop qua IP VLAN200 (Docker publish port trên mọi interface của host):
- Zabbix web:
http://10.10.200.12:8080— loginAdmin/zabbix. - Grafana:
http://10.10.200.12:3000— loginadmin/Zxcasd123!@#.
Cho host “Zabbix server” xanh: container
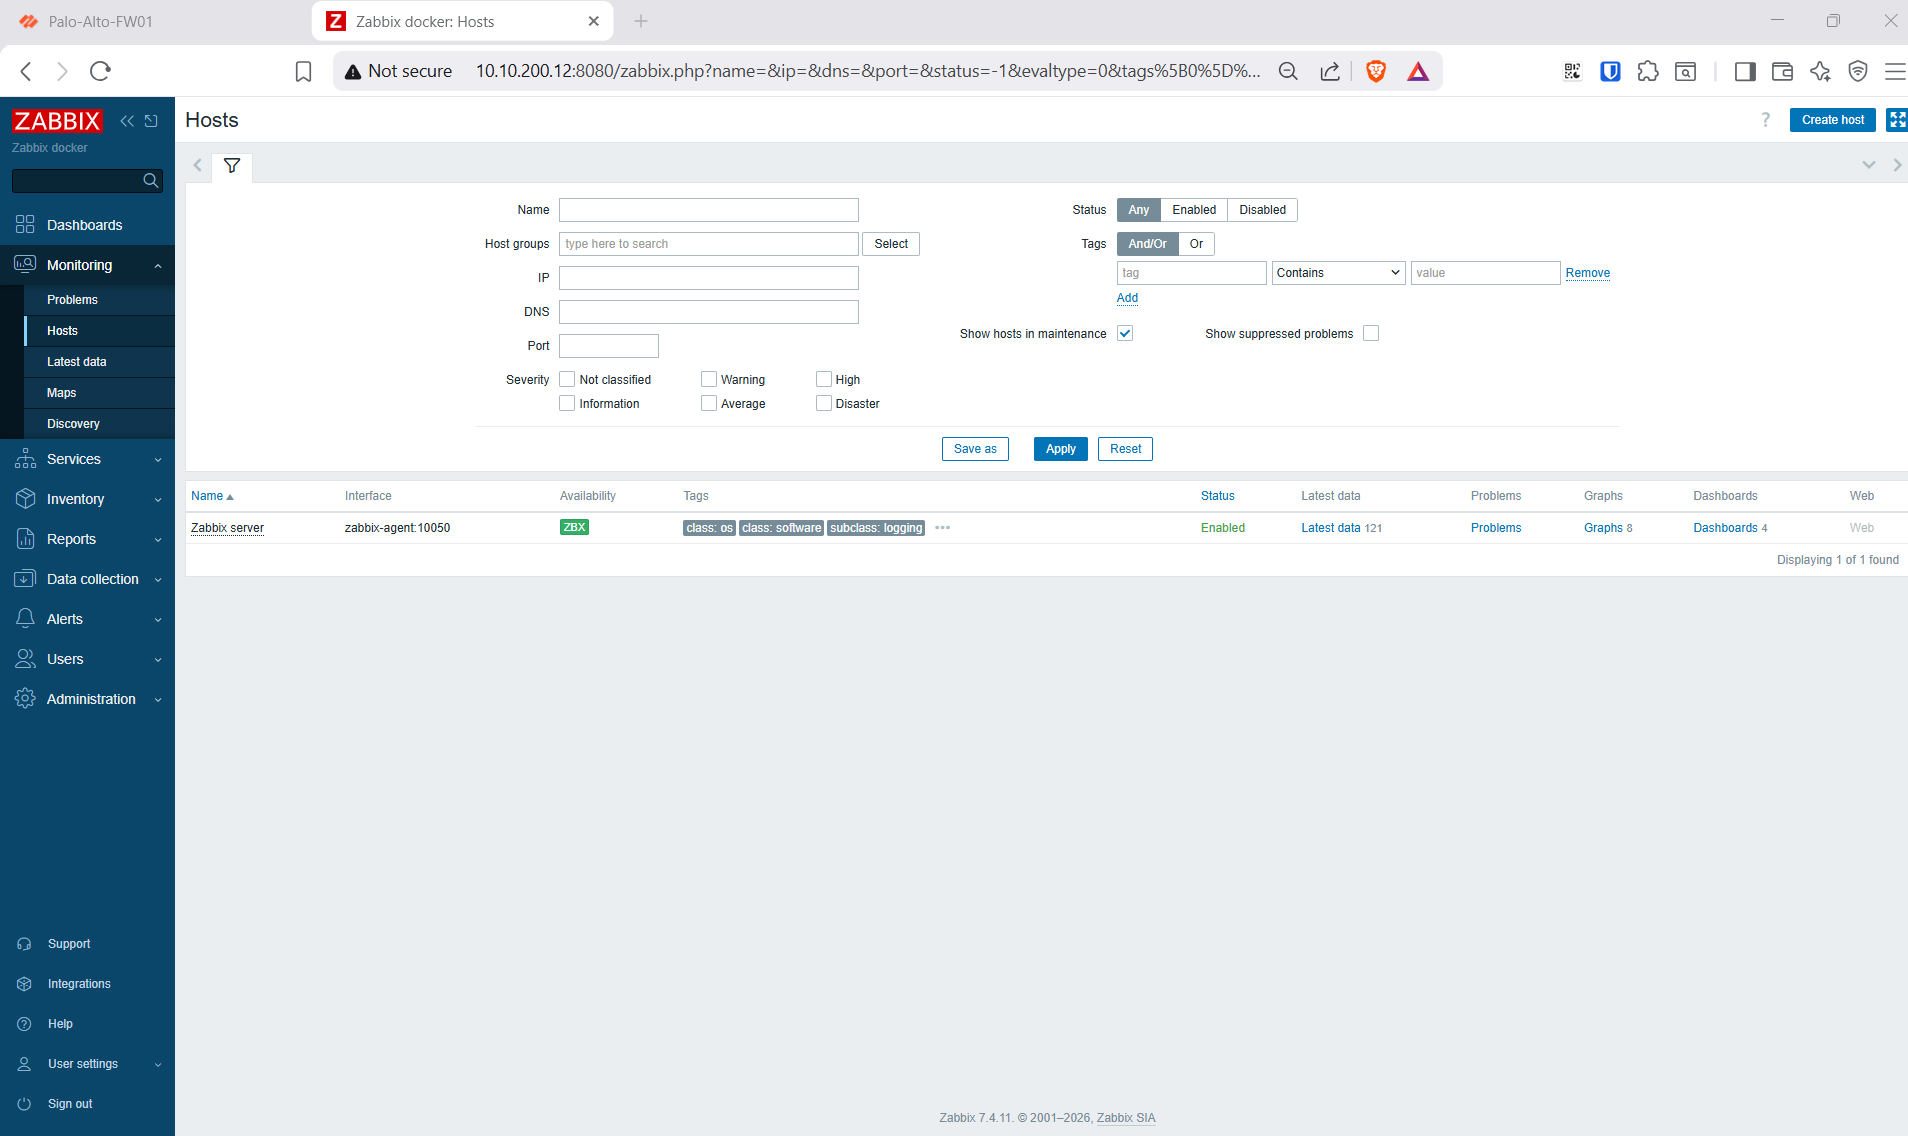
zabbix-agent2self-monitor server. Nhưng host mặc định “Zabbix server” trỏ agent tới127.0.0.1— từ trong container đó là chính nó, không phải agent. Vào Data collection → Hosts → Zabbix server → Interfaces, đổi Agent interface: Connect toDNS, DNS name =zabbix-agent, port10050→ Update. Sau ~1 phút host chuyển xanh (ZBX).
Step 7: Thêm host PA vào Zabbix
Mục tiêu: host PA có (a) SNMP → Tổng WAN, (b) API → TN/QT download.
Vào Zabbix web → Data collection → Hosts → Create host:
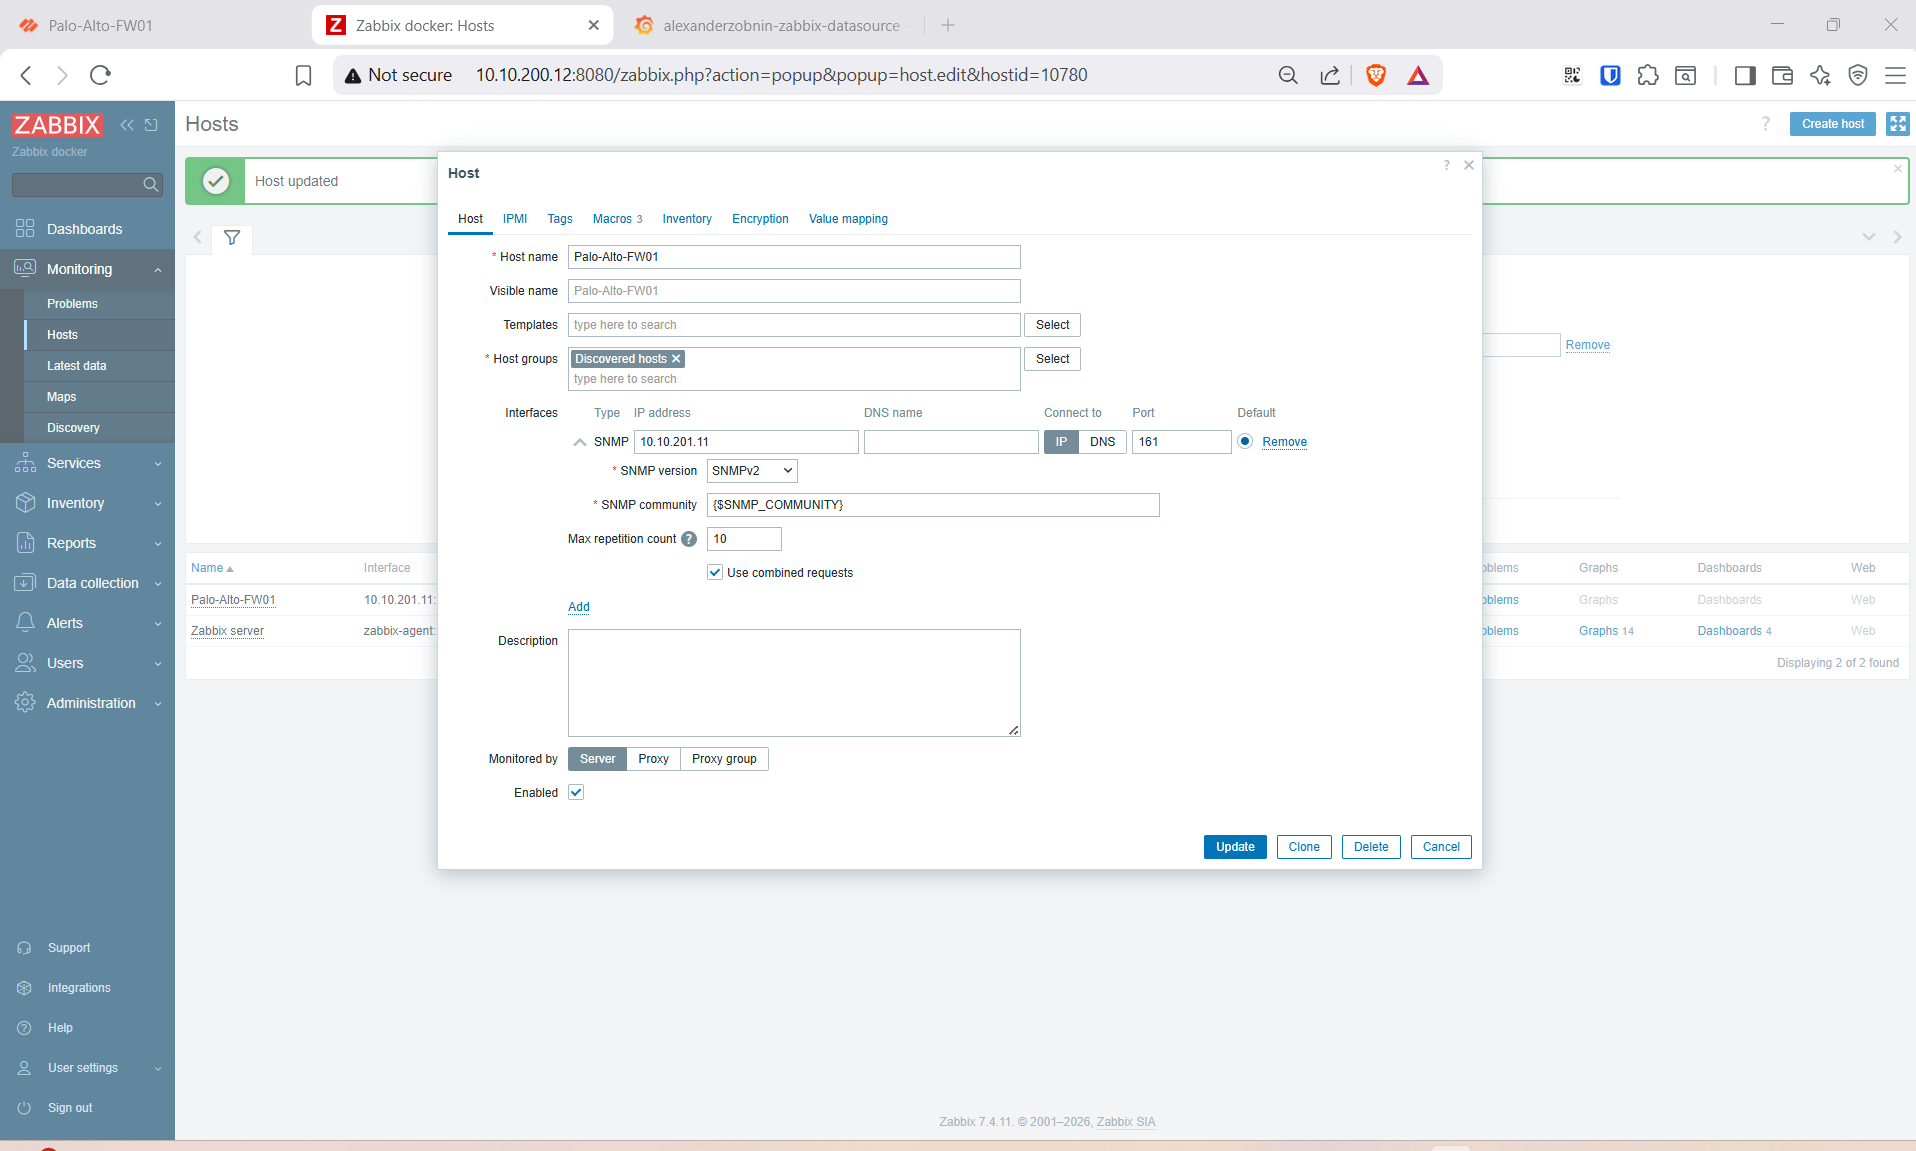
- Host name:
Palo-Alto-FW01, Host groups:Discovered hosts(hoặc tạo group tùy ý). - Interfaces: Add → SNMP, IP
10.10.201.11, versionSNMPv2, community{$SNMP_COMMUNITY}. - Macros:
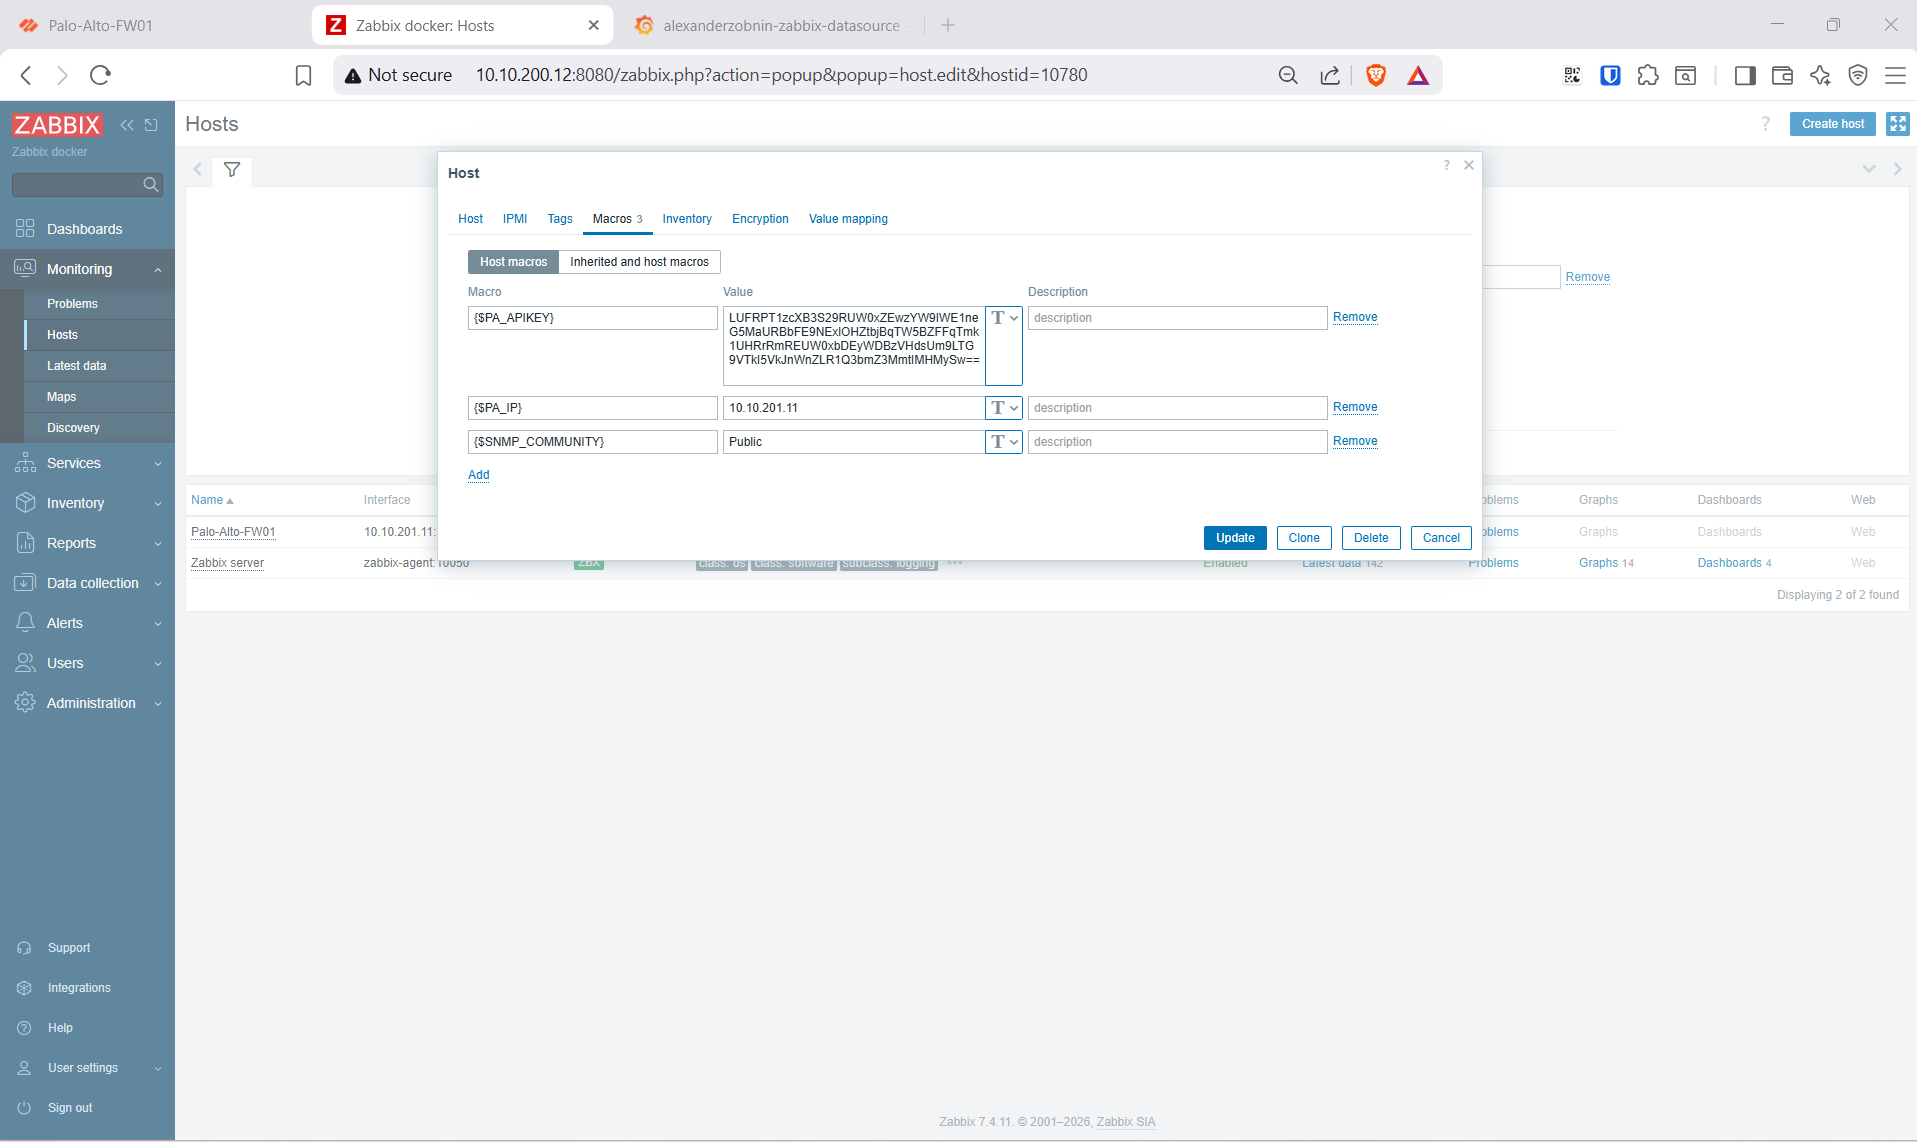
| Macro | Value |
|---|---|
{$SNMP_COMMUNITY} |
Public |
{$PA_IP} |
10.10.201.11 |
{$PA_APIKEY} |
<APIKEY> (từ Step 4, đủ ==) |
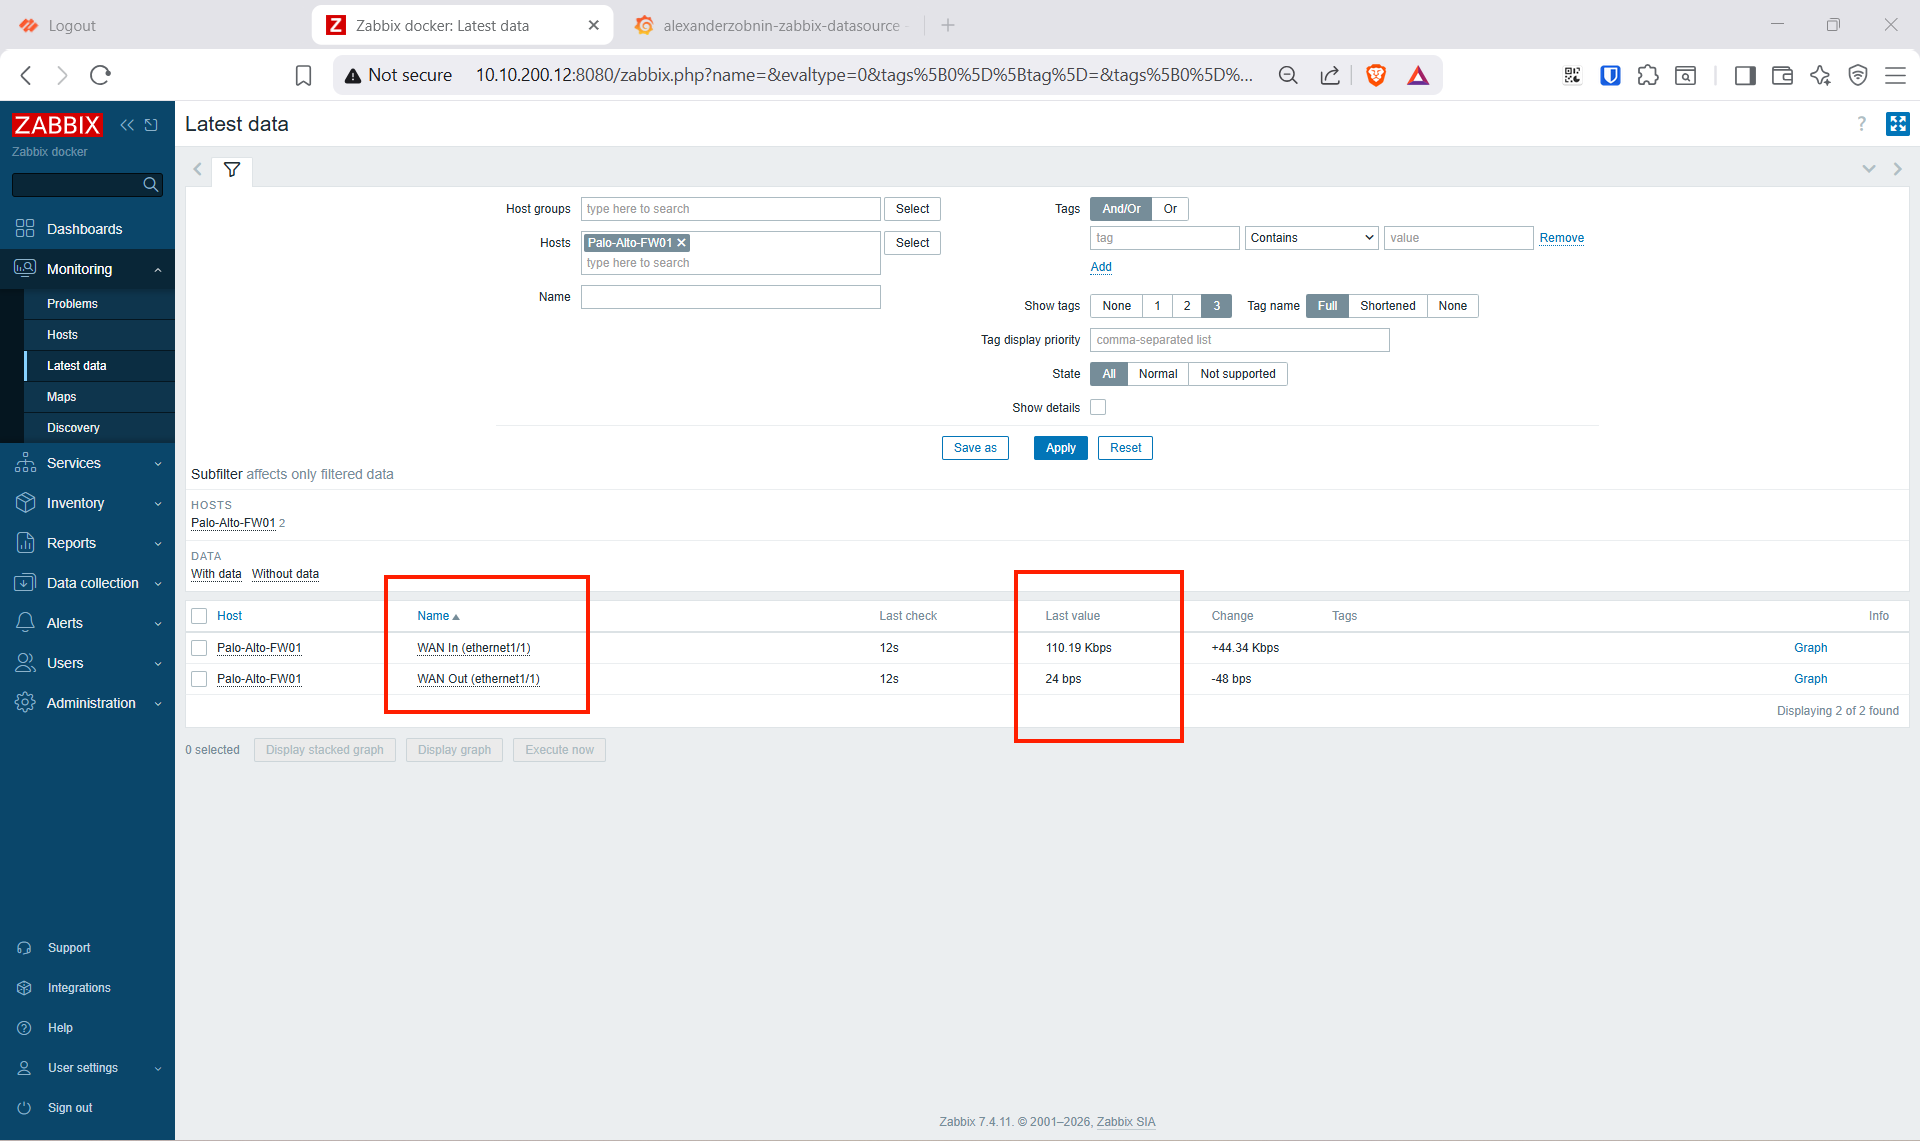
7a. Total WAN — 2 item SNMP thủ công
Không dùng template
Network Generic Device by SNMPcho Total — PA-VM báo cả interface logic (vlan/loopback) khiến template dễ map nhầm ifIndex về counter = 0. Trỏ thẳng ifIndex vật lý cho chắc.
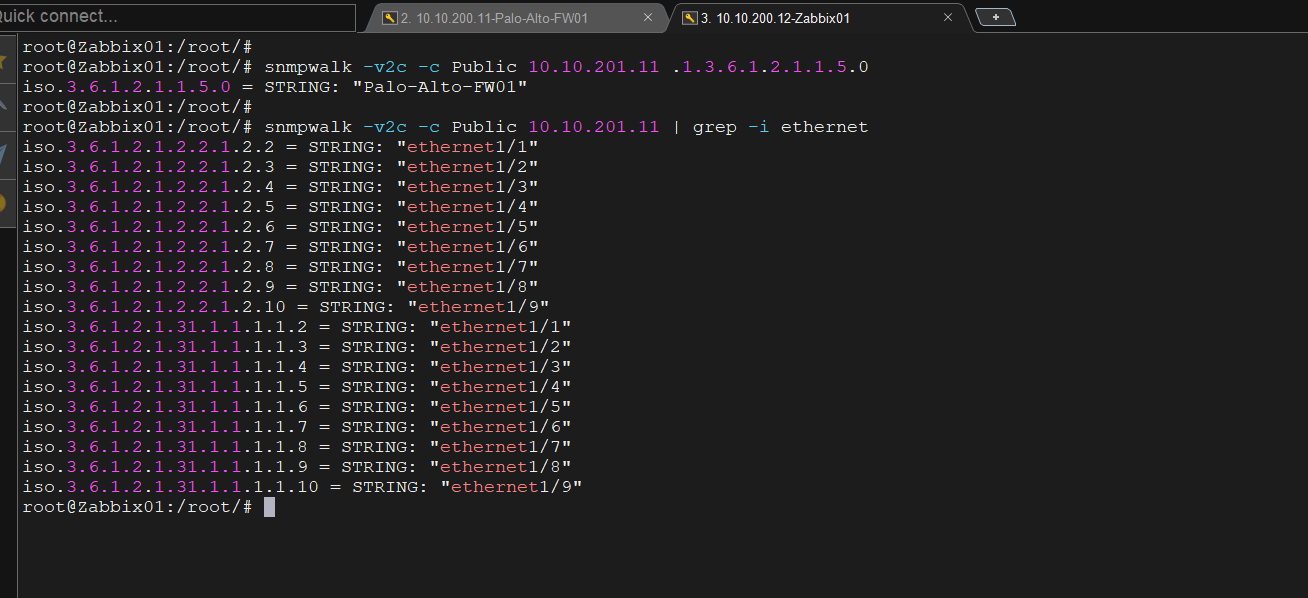
Xác định ifIndex của ethernet1/1 (từ Ubuntu) — walk cột tên interface ifDescr để đọc số cuối OID = ifIndex:
snmpwalk -v2c -c Public 10.10.201.11 | grep -i ethernet
# ...1.2.2 = "ethernet1/1"  → số cuối = 2 → ifIndex ethernet1/1 = 2
# ...1.2.3 = "ethernet1/2"  → ifIndex ethernet1/2 = 3
Chỉ walk
ifDescr(.2.2.1.2) để lấy con số ifIndex, KHÔNG lấy số liệu từ đây. Counter byte thật sẽ trỏ sang bảng mở rộngifXTable(.31) — nơi có counter 64-bitifHCInOctets/OutOctetskhông bị tràn (bảng cũ.2.2chỉ có counter 32-bit, link tốc độ cao tràn vài giây/lần → số sai).
Items → Create item (2 item). Cột SNMP OID kết thúc bằng ifIndex .2 (= ethernet1/1) tìm ở trên:
| WAN In | WAN Out | |
|---|---|---|
| Name | WAN In (ethernet1/1) |
WAN Out (ethernet1/1) |
| Type | SNMP agent |
SNMP agent |
| Key | pa.wan.in |
pa.wan.out |
| SNMP OID | .1.3.6.1.2.1.31.1.1.1.6.2(ifHCInOctets, ifIndex 2) |
.1.3.6.1.2.1.31.1.1.1.10.2(ifHCOutOctets, ifIndex 2) |
| Units / Type | bps / Numeric (unsigned) |
bps / Numeric (unsigned) |
| Update | 30s |
30s |
| Preprocessing (2 bước, đúng thứ tự) |
1. Change per second2. Custom multiplier = 8 |
1. Change per second2. Custom multiplier = 8 |
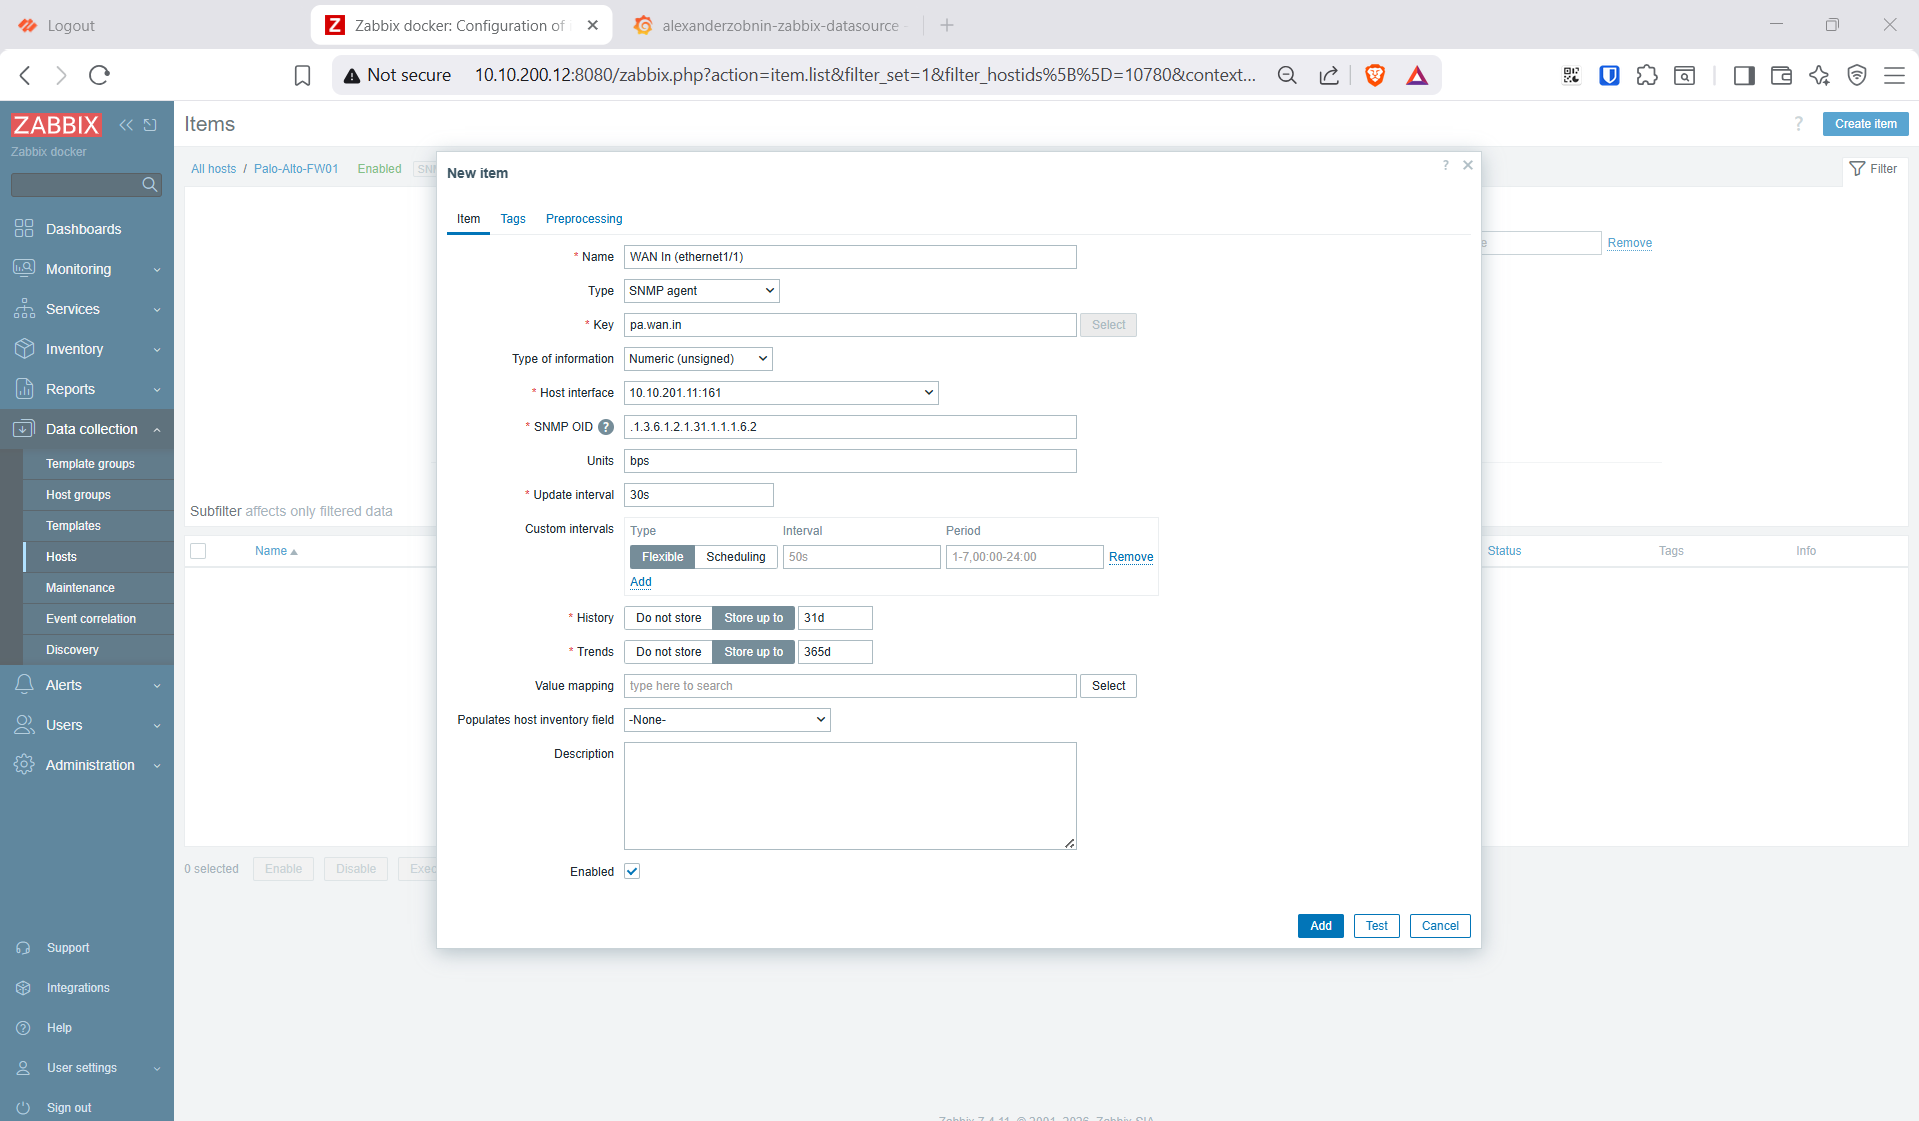
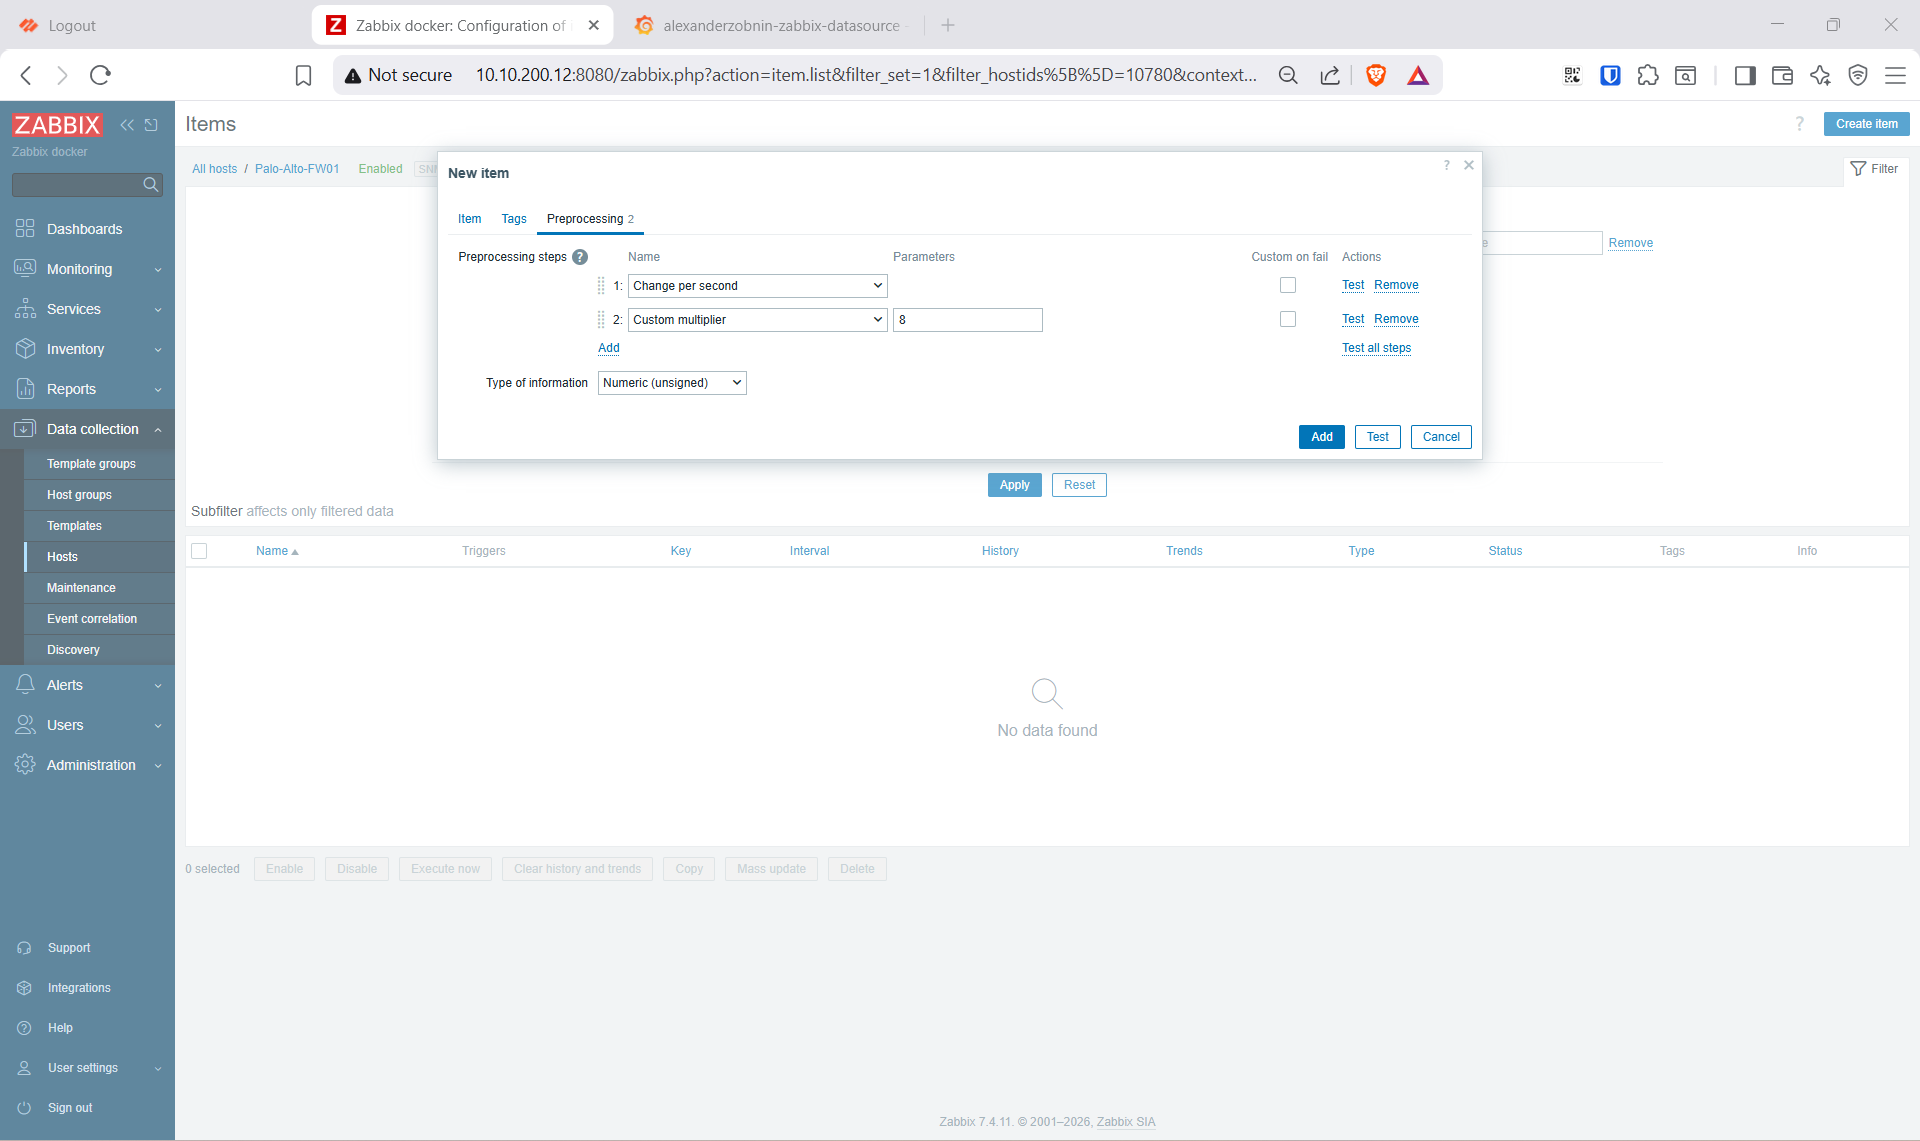
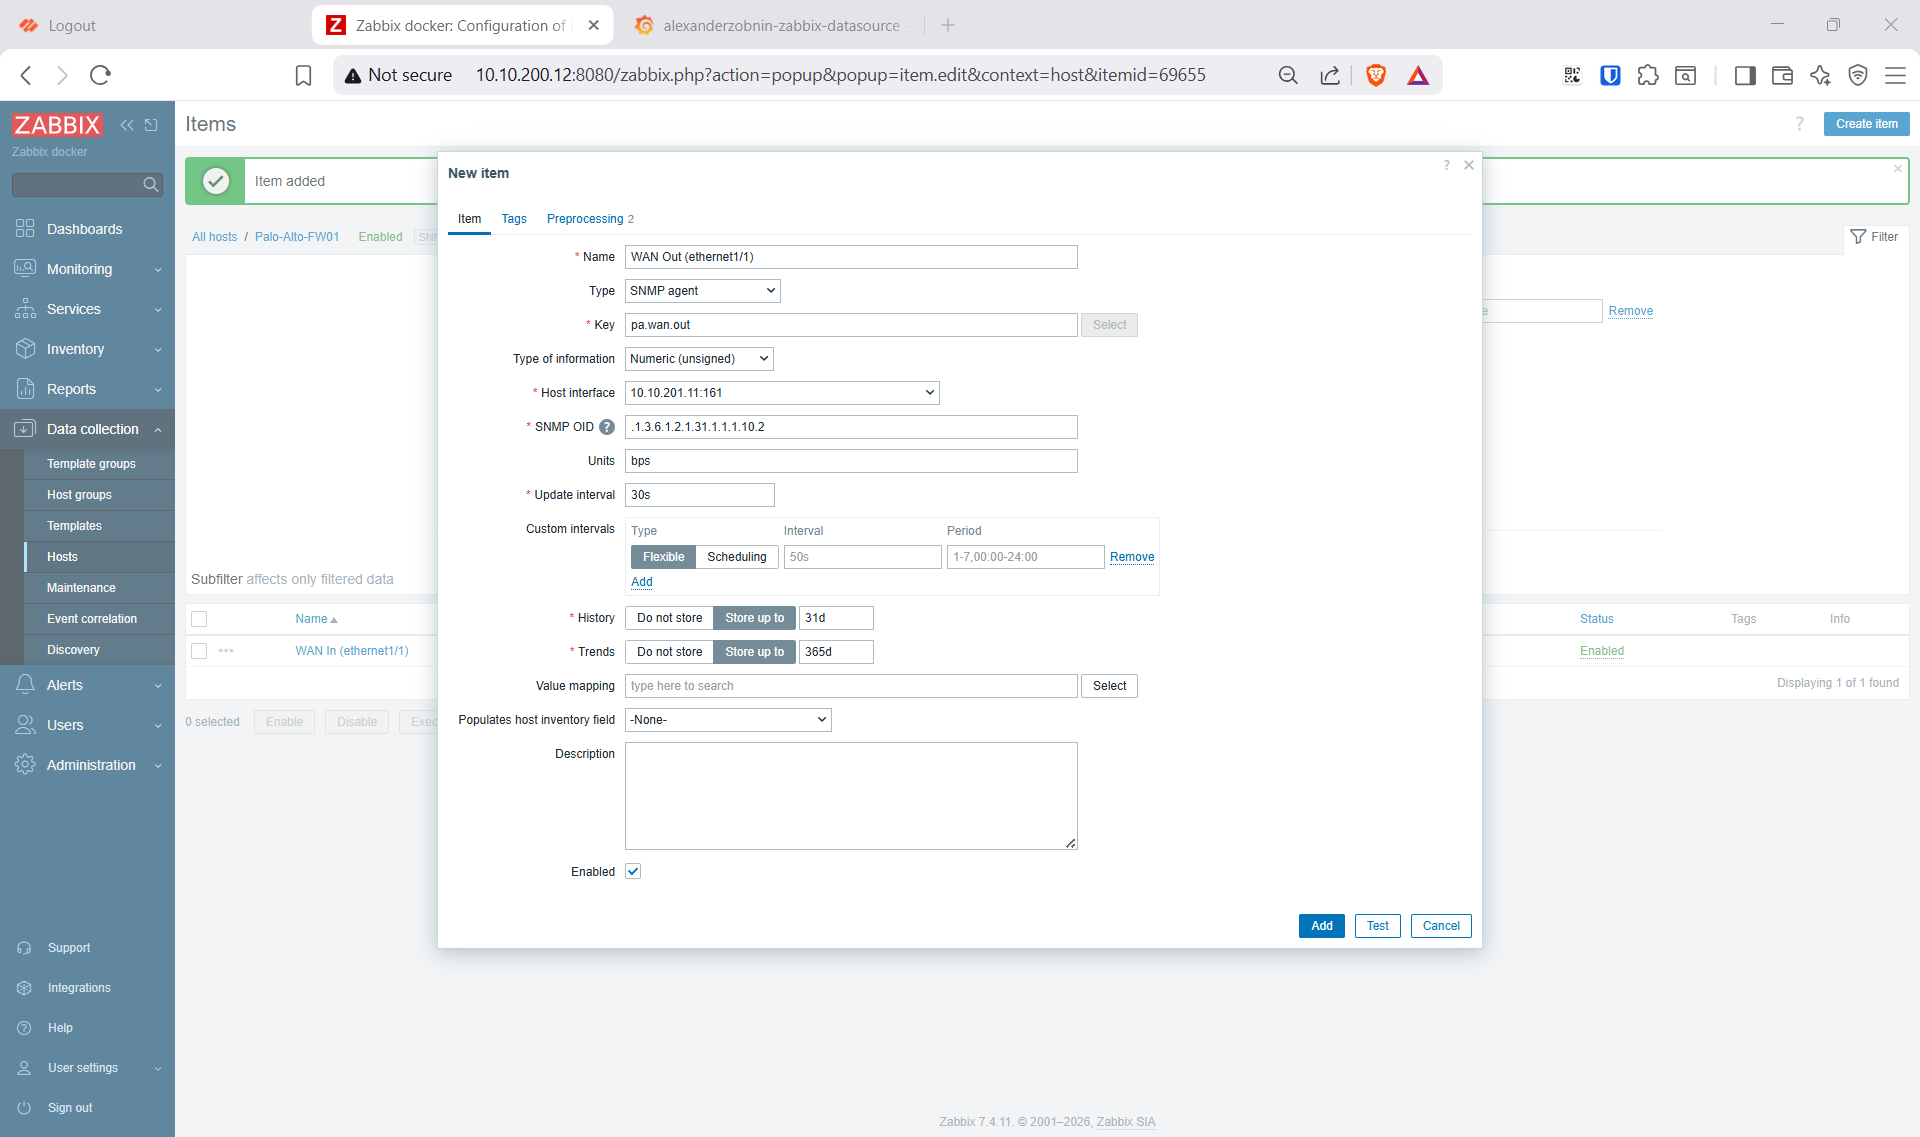
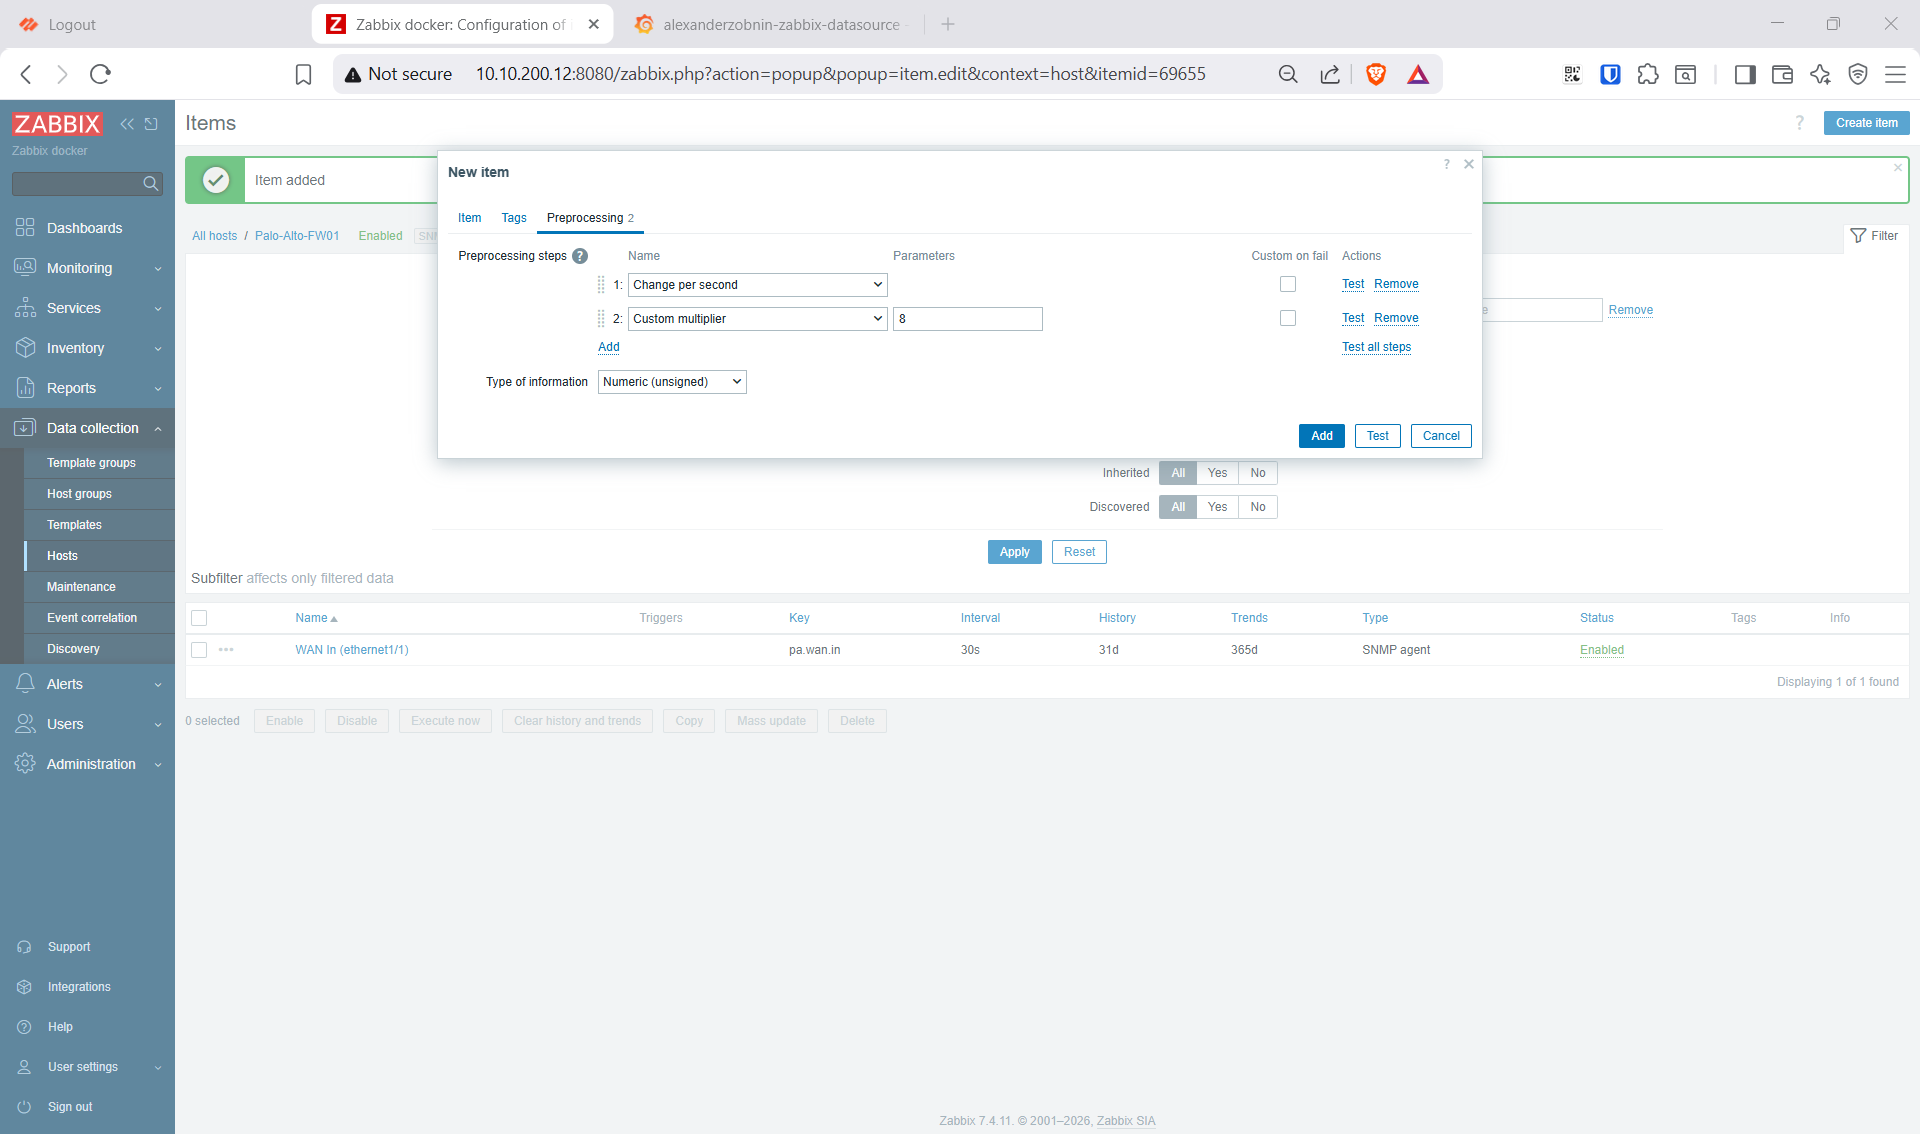
Hiểu cấu trúc OID — nhìn dài nhưng chỉ ghép từ 3 phần:
.1.3.6.1.2.1.31.1.1.1  .  6  .  2
└──────┬────────────┘    │     │
   bảng ifXTable      cột   ifIndex
   (cố định)          nào   (interface nào)
- Đầu
.1.3.6.1.2.1.31.1.1.1= địa chỉ bảngifXTable— hằng số của chuẩn SNMP, thiết bị nào cũng vậy. - Số áp chót = cột (đọc thông số gì): do chuẩn IF-MIB (RFC 2863) quy định sẵn —
.1=ifName,.6=ifHCInOctets(byte nhận),.10=ifHCOutOctets(byte gửi). - Số cuối = ifIndex (interface nào):
.2= ethernet1/1 (tra ở bước snmpwalk trên).
Lệnh snmpwalk phía trên trả cột .1 (ifName) nên ra tên "ethernet1/1". Muốn lấy byte counter, chỉ việc đổi số cột .1 → .6/.10, giữ nguyên ifIndex .2:
| OID | Cột | Đọc ra |
|---|---|---|
...31.1.1.1.1.2 |
ifName |
tên ethernet1/1 (snmpwalk hiện) |
...31.1.1.1.6.2 |
ifHCInOctets |
byte nhận → WAN In |
...31.1.1.1.10.2 |
ifHCOutOctets |
byte gửi → WAN Out |
Tự kiểm chứng — chạy 2 lần cách nhau vài giây, số phải tăng (counter đang đếm):
snmpget -v2c -c Public 10.10.201.11 .1.3.6.1.2.1.31.1.1.1.6.2
# → Counter64: <tổng byte nhận tích lũy của ethernet1/1>
Vì sao 2 bước preprocessing: OID trả về là tổng byte tích lũy (counter chỉ tăng, không phải tốc độ). Bước 1
Change per second= lấy hiệu 2 lần poll chia thời gian → ra byte/giây. Bước 2Custom multiplier 8= đổi byte/s → bit/s (bps) (1 byte = 8 bit). Sai thứ tự hoặc thiếu 1 bước là số ra sai. Nếu ifIndex của bạn khác2, đổi số cuối OID cho khớp.
7b. TN/QT download — master + 2 dependent
1 API call (node download eth1/2) trả về cả class 4 và class 5 → 1 master item lấy raw + 2 dependent tách bằng regex.
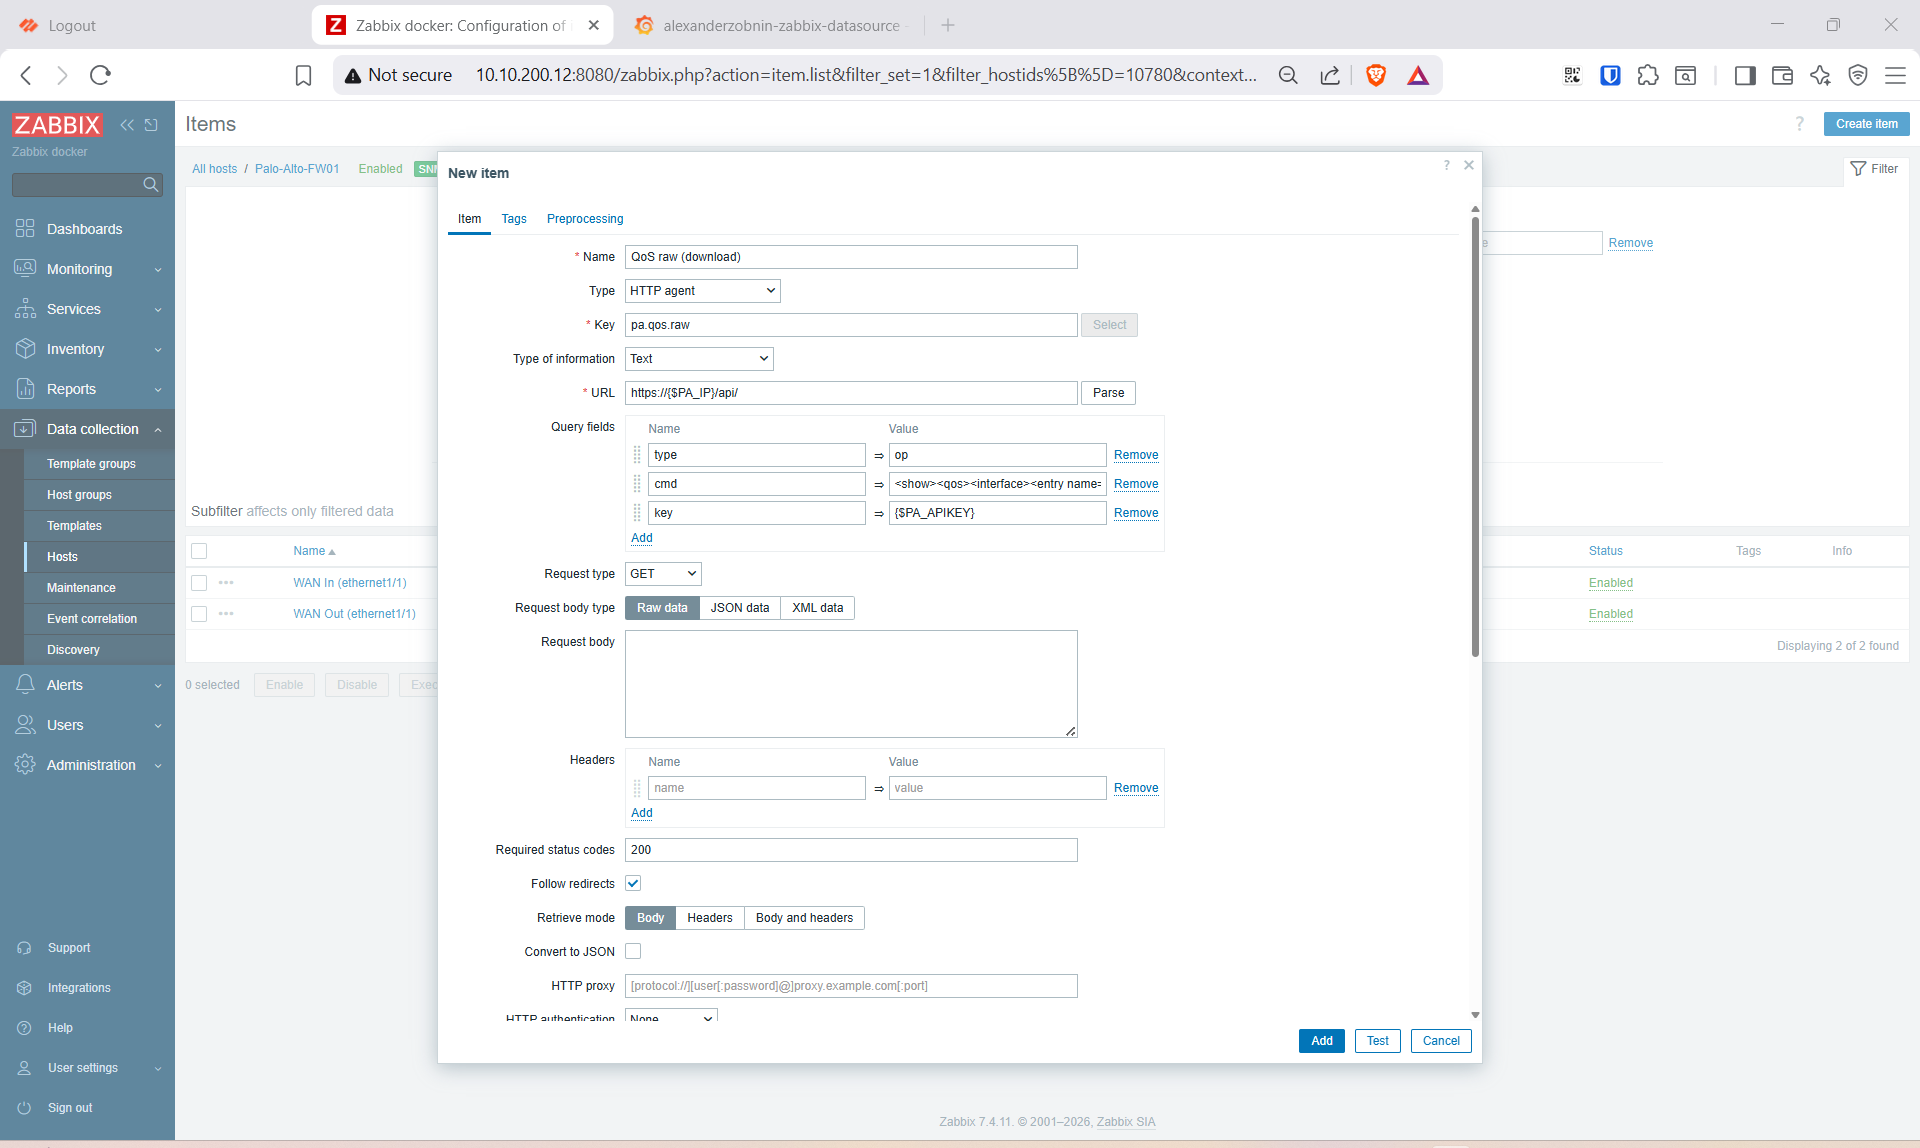
Master item (Items → Create item):
| Trường | Giá trị |
|---|---|
| Name | QoS raw (download) |
| Type | HTTP agent · Key pa.qos.raw |
| URL | https://{$PA_IP}/api/ |
| Query fields | type=op · cmd=<show><qos><interface><entry name='ethernet1/2'><throughput>1</throughput></entry></interface></qos></show> · key={$PA_APIKEY} |
| SSL verify peer / host | bỏ tick cả hai |
| Timeout | 30s (op command PA-VM chậm, mặc định 3s hay timeout) |
| Type of information | Text |
| Update interval | 30s |
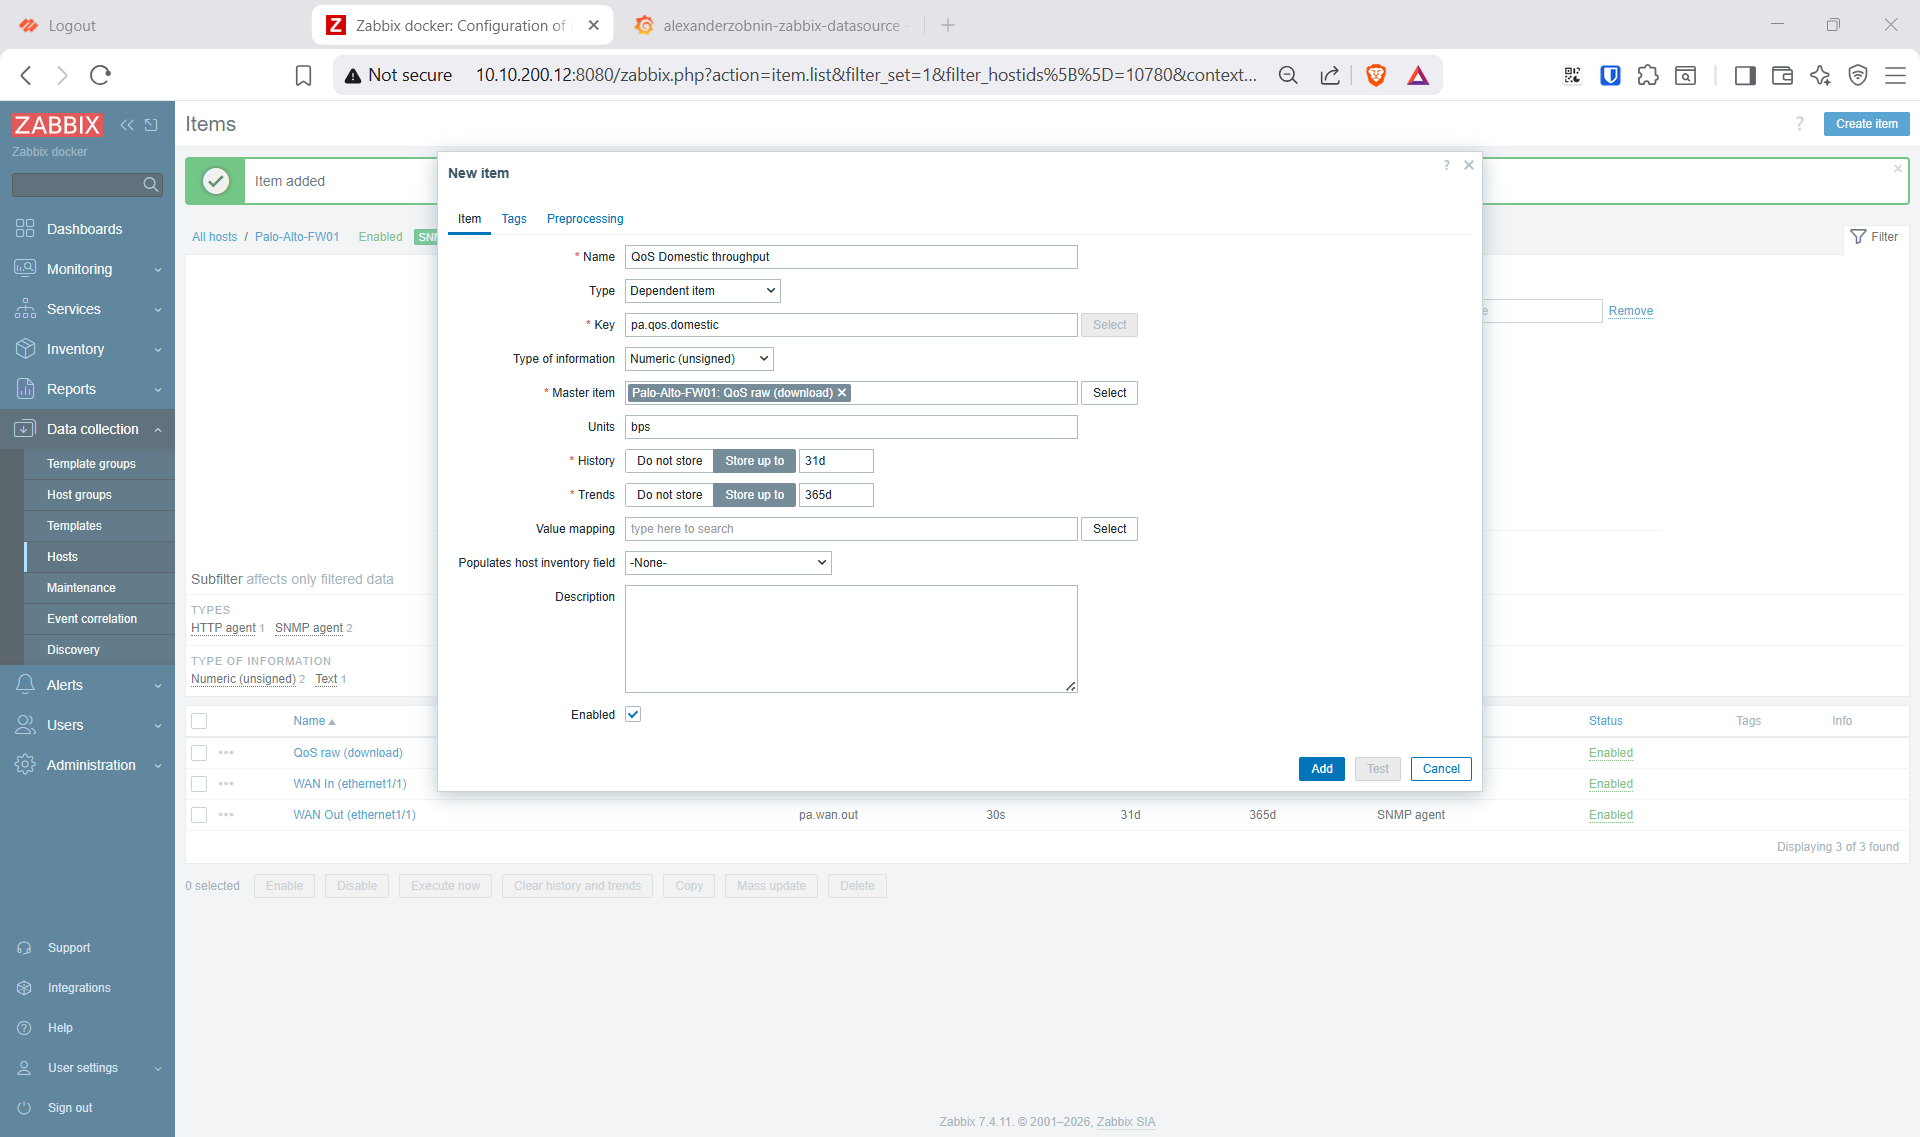
Dependent item Domestic (Create dependent item, Master = QoS raw (download)):
- Name
QoS Domestic throughput· Keypa.qos.domestic· Numeric (unsigned) · Unitsbps - Preprocessing: 1)
Regular expressionclass 4:\s+(\d+)\s+kbps→\1, Custom on fail = Set value02)Custom multiplier1000
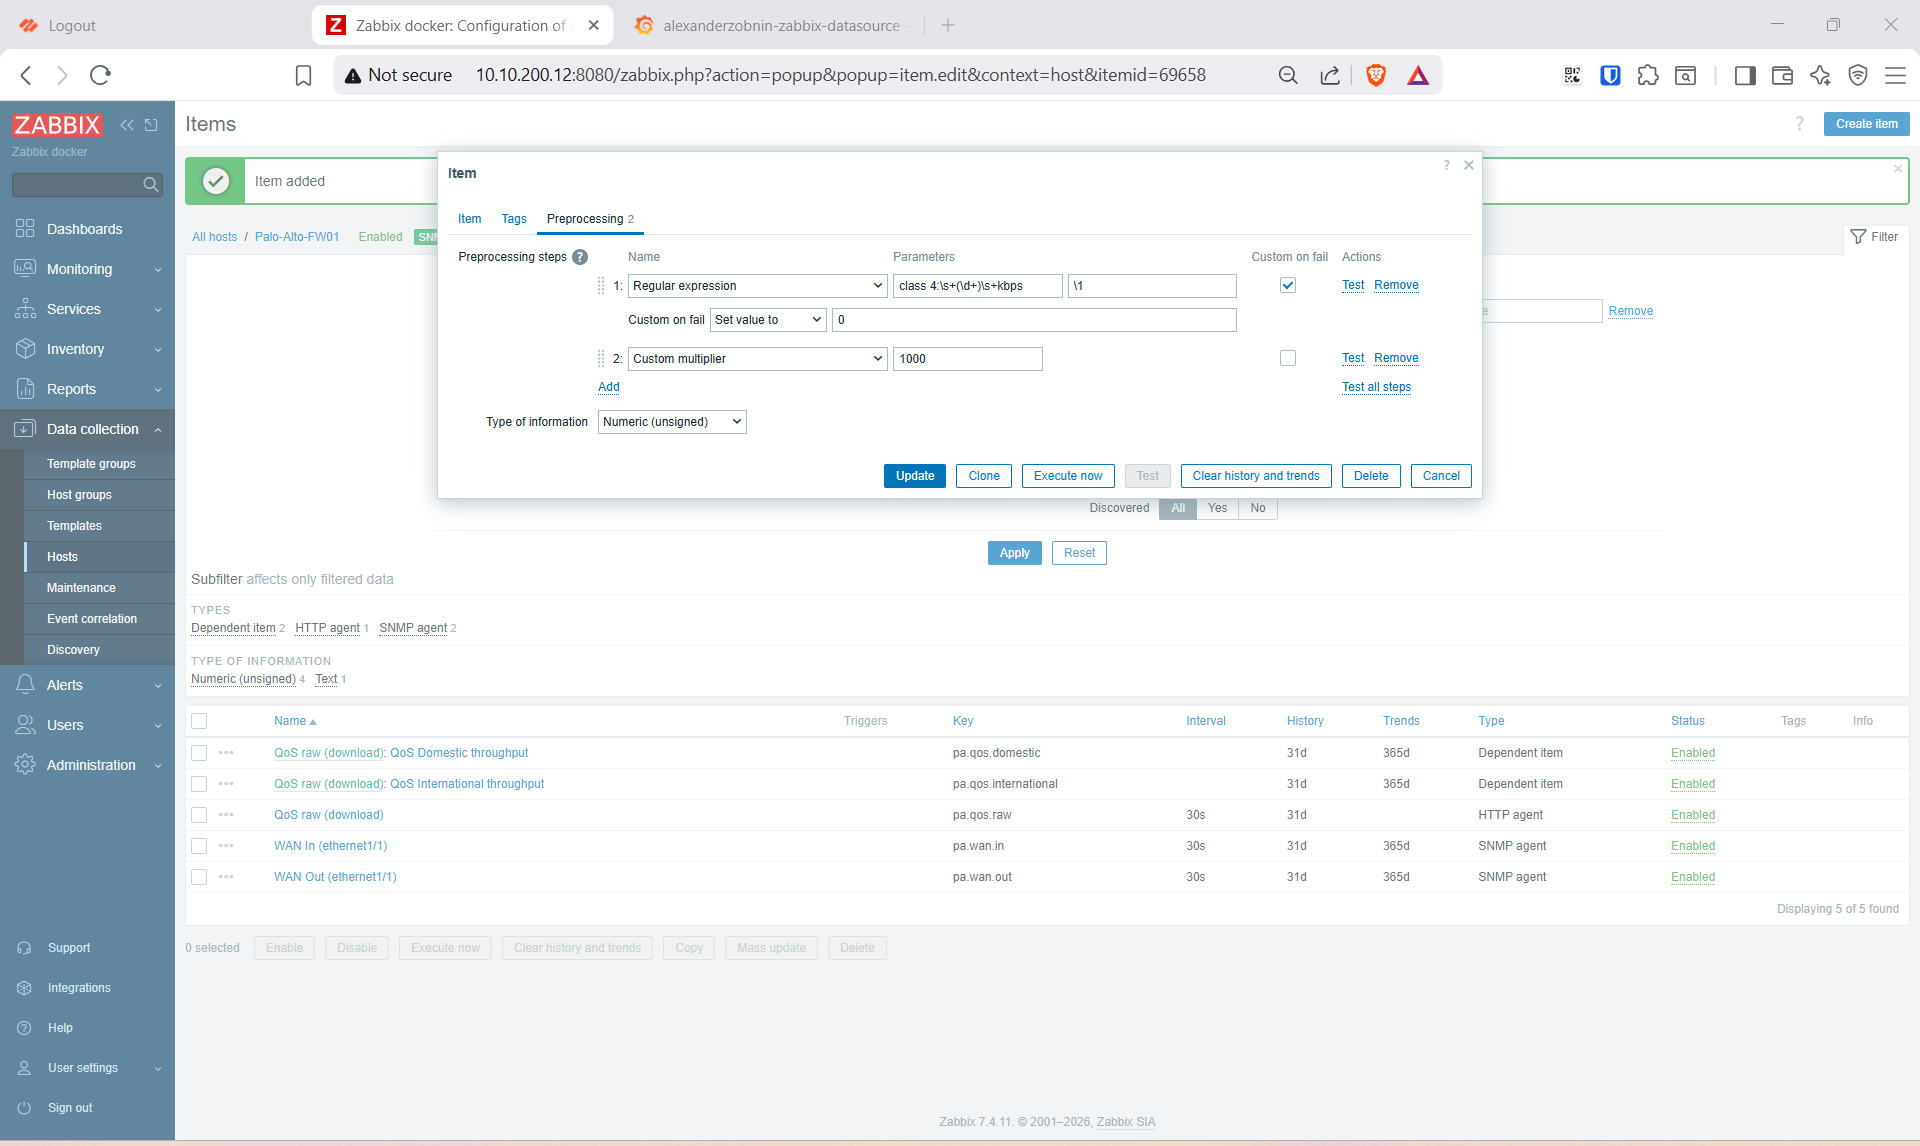
Dependent item International: giống hệt, đổi Name QoS International throughput, Key pa.qos.international, regex class 5:\s+(\d+)\s+kbps.
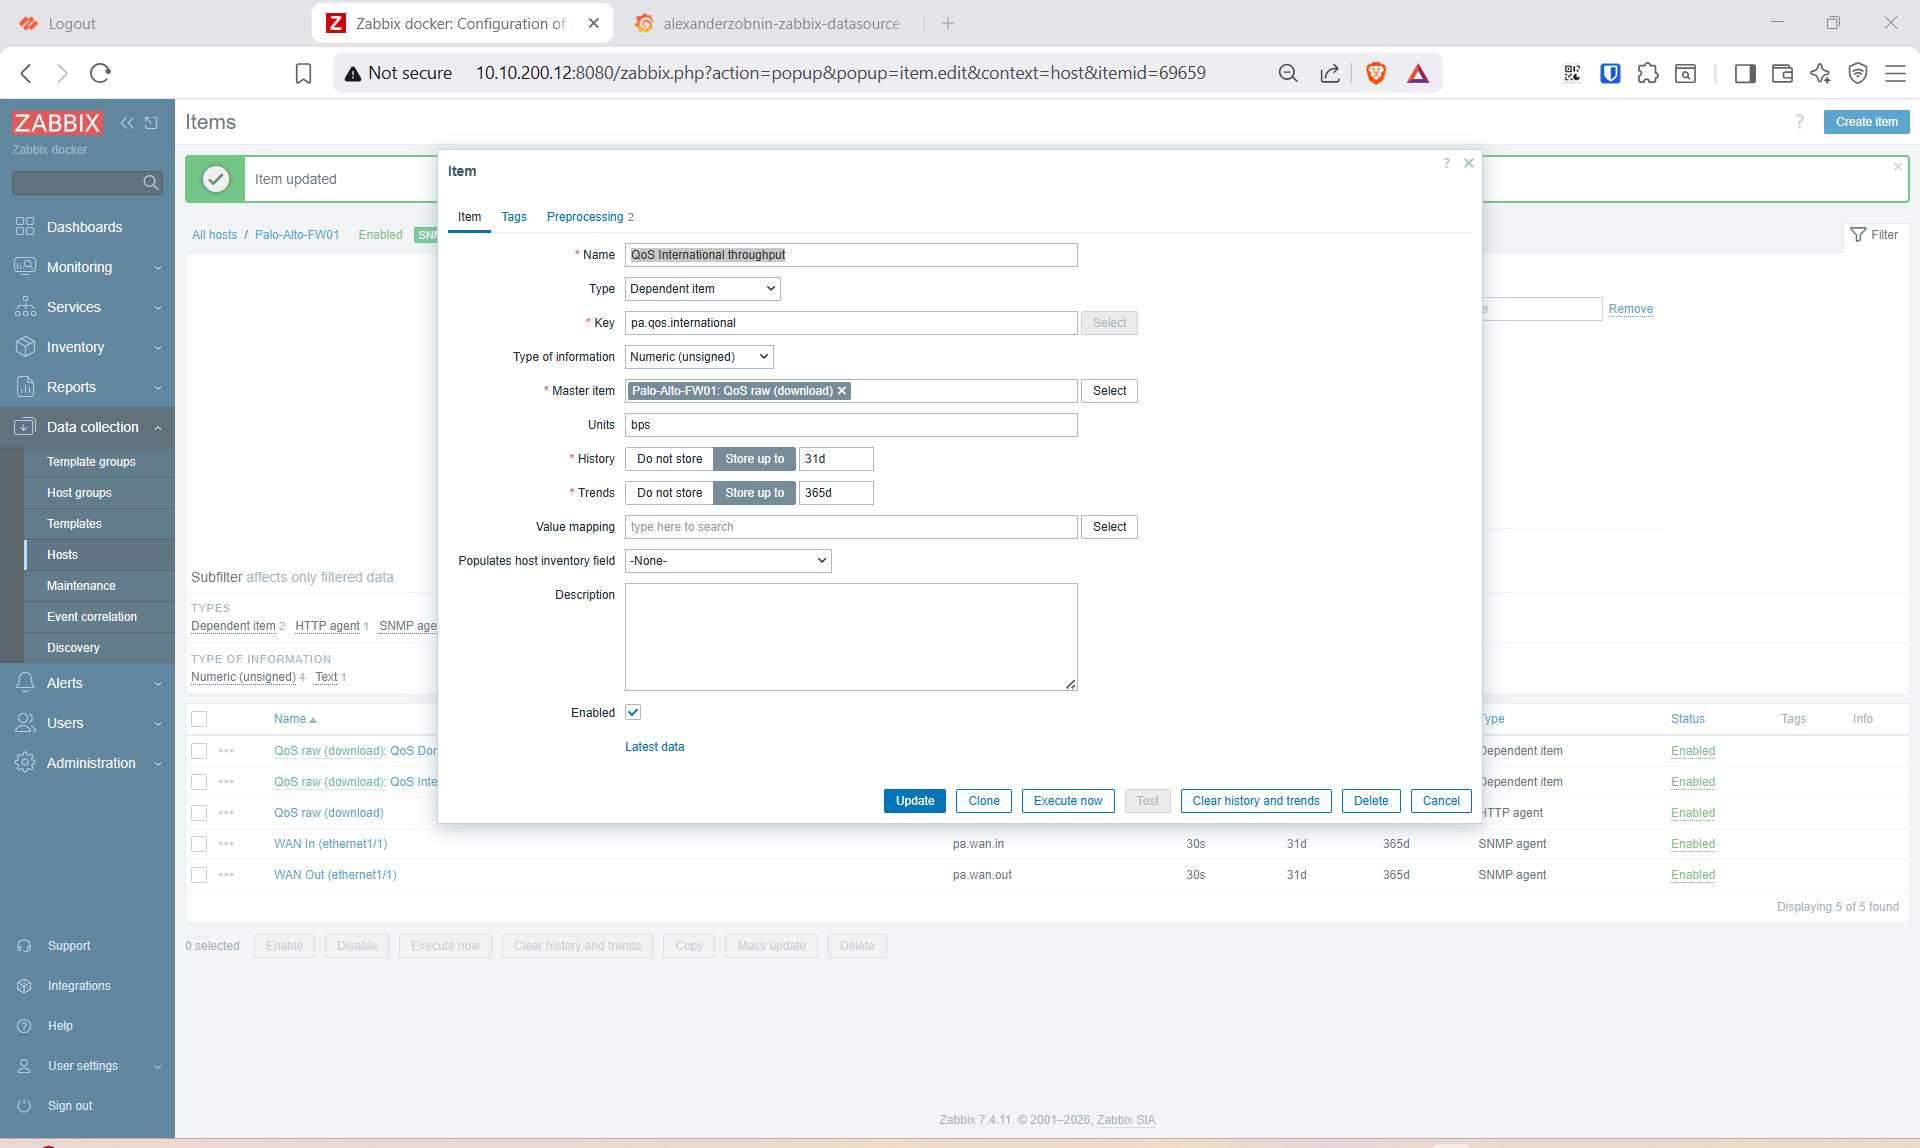
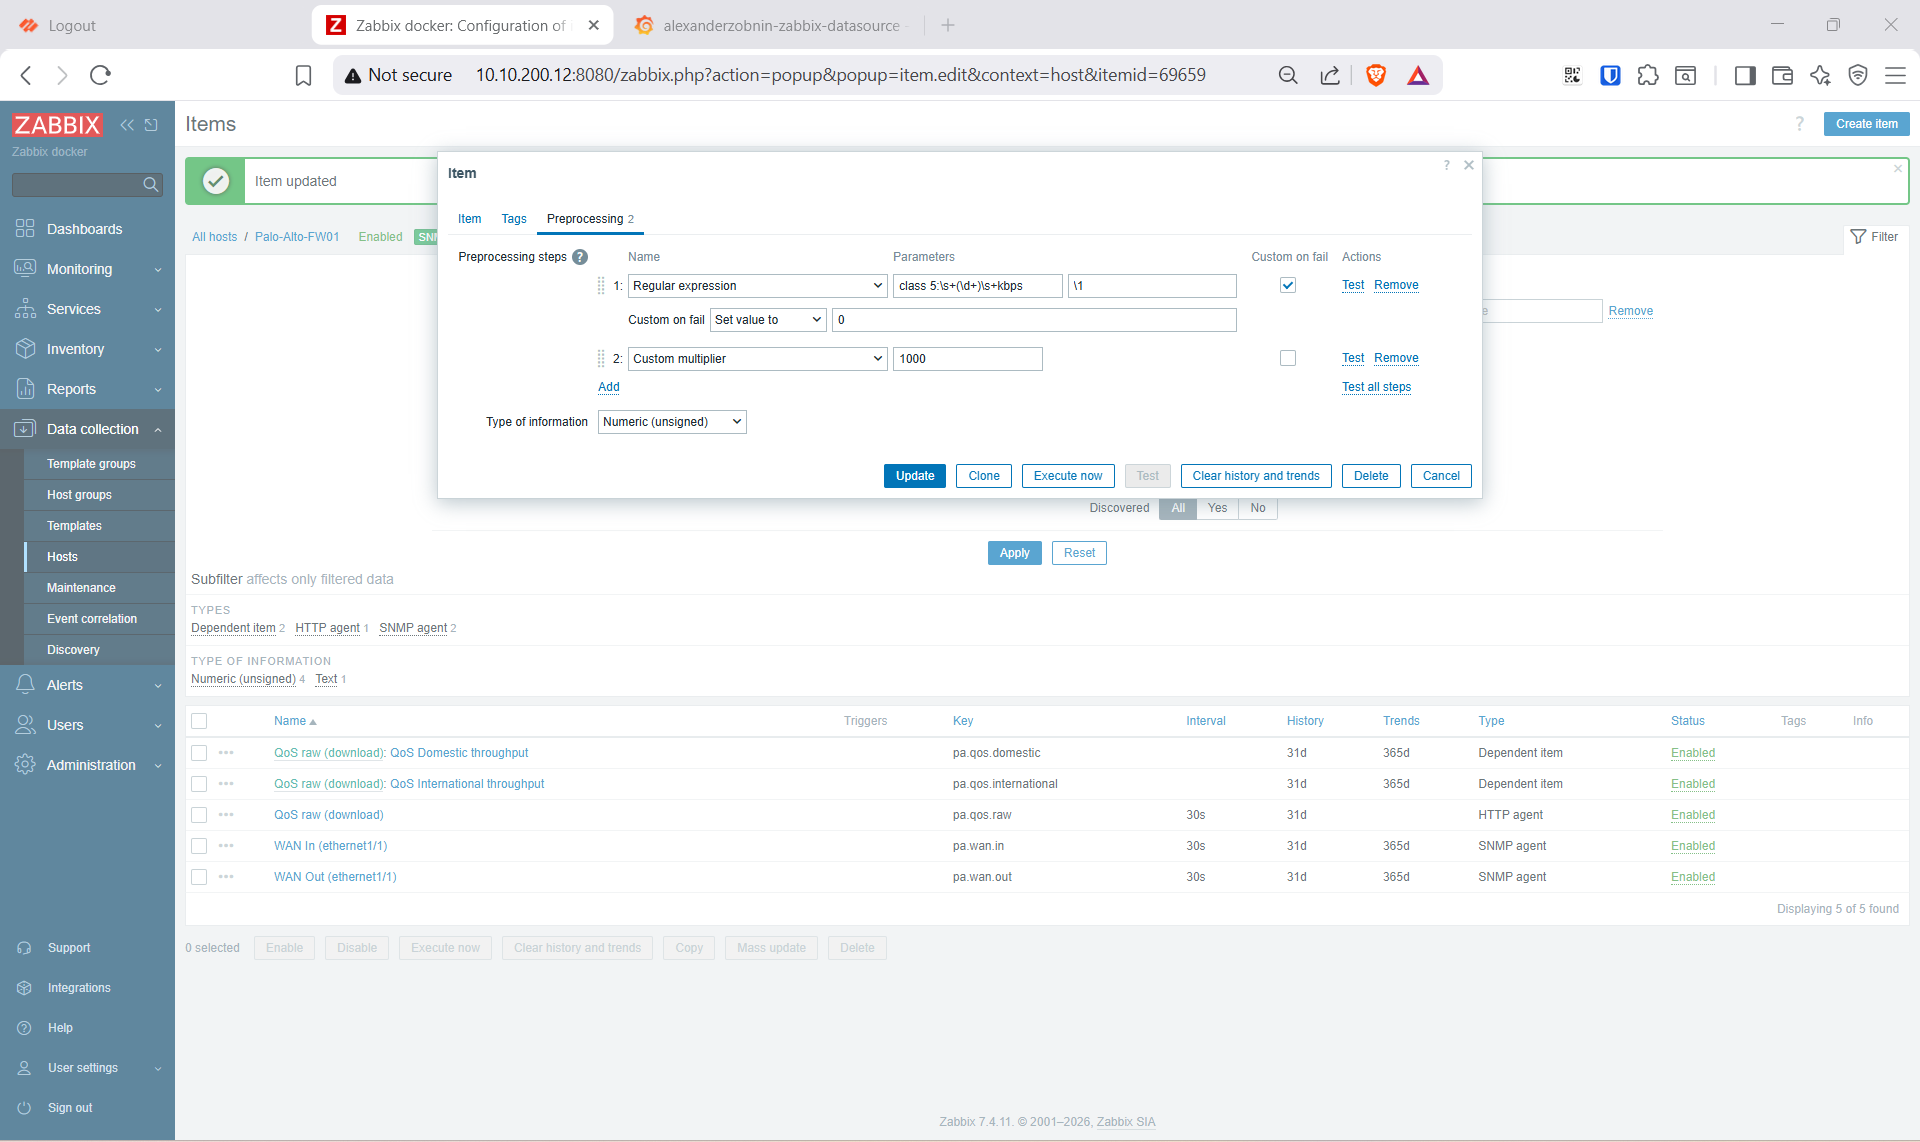
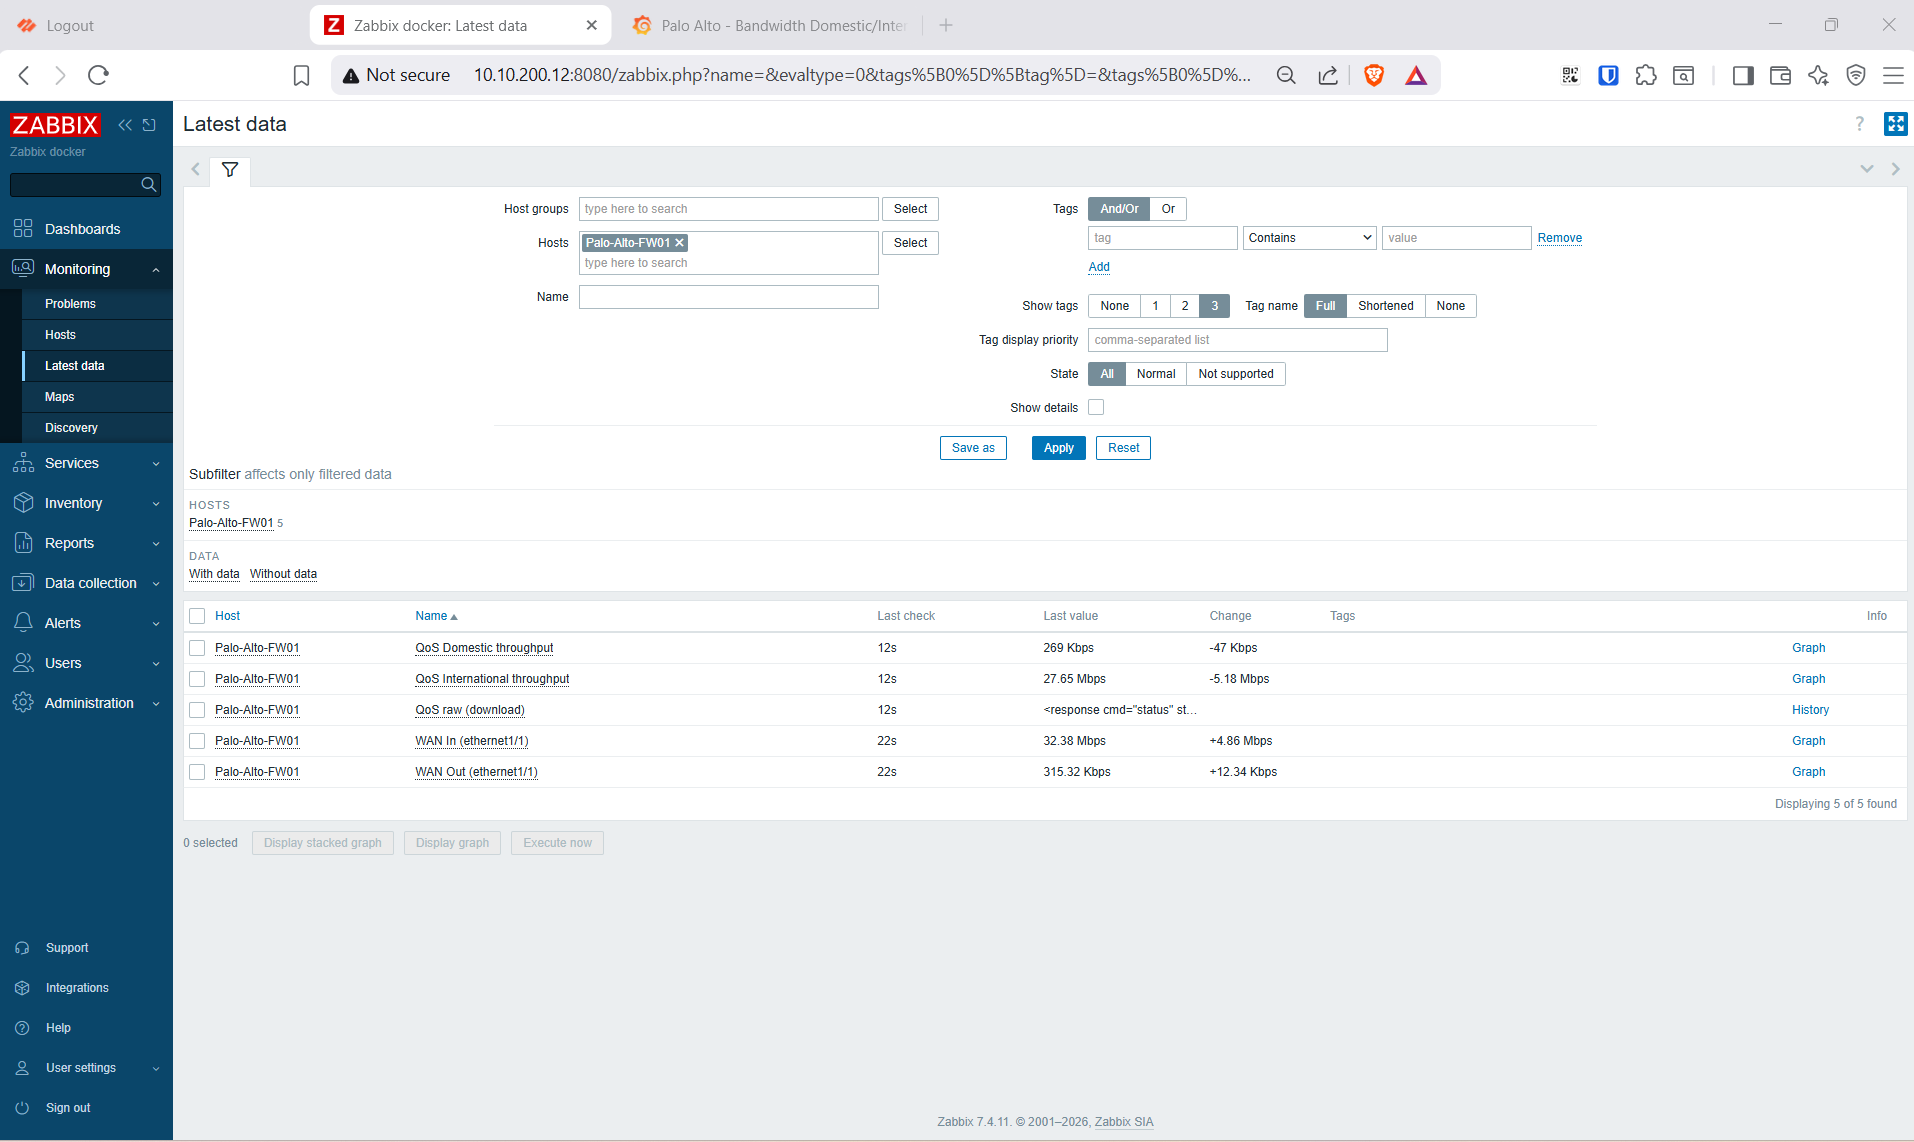
Kết quả mong đợi: Monitoring → Latest data host Palo-Alto-FW01 (sinh traffic ở Step 10): WAN In/Out (Tổng), QoS Domestic throughput, QoS International throughput đều nhảy số.
# Tạo traffic để check
curl -s -o /dev/null https://proof.ovh.net/files/1Gb.dat &                                                     # QT → class 5
curl -s -o /dev/null http://mirror.bizflycloud.vn/ubuntu-releases/24.04/ubuntu-24.04.4-live-server-amd64.iso &  # TN → class 4

sleep 60
kill %1 %2
Step 8: Grafana dashboard
Mục tiêu: dashboard 3 panel, hiện số Last/Max dưới đồ thị.
1. Bật plugin + data source: Administration → Plugins → Zabbix → Enable. Rồi Connections → Data sources → Add → Zabbix:
- URL
http://zabbix-web:8080/api_jsonrpc.php(Grafana cùng compose network). - Zabbix API: Username
Admin, Passwordzabbix, tick Trends. Save & test → “Zabbix API version: 7.4.x”.
2. Import dashboard sẵn — Dashboards → New → Import, dán JSON dưới đây, chọn data source Zabbix vừa tạo:
{
  "__inputs": [
    { "name": "DS_ZABBIX", "label": "Zabbix", "type": "datasource", "pluginId": "alexanderzobnin-zabbix-datasource" }
  ],
  "title": "Palo Alto - Bandwidth Domestic/International",
  "timezone": "browser",
  "refresh": "10s",
  "time": { "from": "now-1h", "to": "now" },
  "schemaVersion": 39,
  "panels": [
    {
      "type": "timeseries", "title": "Tổng (WAN)",
      "gridPos": { "h": 9, "w": 24, "x": 0, "y": 0 },
      "datasource": { "type": "alexanderzobnin-zabbix-datasource", "uid": "${DS_ZABBIX}" },
      "fieldConfig": { "defaults": { "unit": "bps", "custom": { "fillOpacity": 10, "showPoints": "never" } } },
      "options": {
        "legend": { "displayMode": "table", "placement": "bottom", "showLegend": true, "calcs": ["lastNotNull", "max", "mean"] },
        "tooltip": { "mode": "multi", "sort": "desc" }
      },
      "targets": [
        { "refId": "A", "queryType": "0", "resultFormat": "time_series", "datasource": { "type": "alexanderzobnin-zabbix-datasource", "uid": "${DS_ZABBIX}" }, "group": { "filter": "/.*/" }, "host": { "filter": "Palo-Alto-FW01" }, "application": { "filter": "" }, "itemTag": { "filter": "" }, "item": { "filter": "WAN In (ethernet1/1)" }, "functions": [], "options": { "showDisabledItems": false } },
        { "refId": "B", "queryType": "0", "resultFormat": "time_series", "datasource": { "type": "alexanderzobnin-zabbix-datasource", "uid": "${DS_ZABBIX}" }, "group": { "filter": "/.*/" }, "host": { "filter": "Palo-Alto-FW01" }, "application": { "filter": "" }, "itemTag": { "filter": "" }, "item": { "filter": "WAN Out (ethernet1/1)" }, "functions": [], "options": { "showDisabledItems": false } }
      ]
    },
    {
      "type": "timeseries", "title": "International",
      "gridPos": { "h": 9, "w": 12, "x": 0, "y": 9 },
      "datasource": { "type": "alexanderzobnin-zabbix-datasource", "uid": "${DS_ZABBIX}" },
      "fieldConfig": { "defaults": { "unit": "bps", "color": { "mode": "fixed", "fixedColor": "orange" }, "custom": { "fillOpacity": 15, "showPoints": "never" } } },
      "options": {
        "legend": { "displayMode": "table", "placement": "bottom", "showLegend": true, "calcs": ["lastNotNull", "max", "mean"] },
        "tooltip": { "mode": "single" }
      },
      "targets": [
        { "refId": "A", "queryType": "0", "resultFormat": "time_series", "datasource": { "type": "alexanderzobnin-zabbix-datasource", "uid": "${DS_ZABBIX}" }, "group": { "filter": "/.*/" }, "host": { "filter": "Palo-Alto-FW01" }, "application": { "filter": "" }, "itemTag": { "filter": "" }, "item": { "filter": "QoS International throughput" }, "functions": [], "options": { "showDisabledItems": false } }
      ]
    },
    {
      "type": "timeseries", "title": "Domestic",
      "gridPos": { "h": 9, "w": 12, "x": 12, "y": 9 },
      "datasource": { "type": "alexanderzobnin-zabbix-datasource", "uid": "${DS_ZABBIX}" },
      "fieldConfig": { "defaults": { "unit": "bps", "color": { "mode": "fixed", "fixedColor": "green" }, "custom": { "fillOpacity": 15, "showPoints": "never" } } },
      "options": {
        "legend": { "displayMode": "table", "placement": "bottom", "showLegend": true, "calcs": ["lastNotNull", "max", "mean"] },
        "tooltip": { "mode": "single" }
      },
      "targets": [
        { "refId": "A", "queryType": "0", "resultFormat": "time_series", "datasource": { "type": "alexanderzobnin-zabbix-datasource", "uid": "${DS_ZABBIX}" }, "group": { "filter": "/.*/" }, "host": { "filter": "Palo-Alto-FW01" }, "application": { "filter": "" }, "itemTag": { "filter": "" }, "item": { "filter": "QoS Domestic throughput" }, "functions": [], "options": { "showDisabledItems": false } }
      ]
    },
    {
      "type": "andrewbmchugh-flow-panel", "title": "Flow — Topology TN/QT",
      "gridPos": { "h": 11, "w": 24, "x": 0, "y": 18 },
      "datasource": { "type": "alexanderzobnin-zabbix-datasource", "uid": "${DS_ZABBIX}" },
      "options": {
        "animationsEnabled": true, "animationControlEnabled": true, "panZoomEnabled": true, "highlighterEnabled": false, "timeSliderEnabled": true, "testDataEnabled": false, "siteConfig": "",
        "svg": "<svg xmlns=\"http://www.w3.org/2000/svg\" width=\"760\" height=\"300\" viewBox=\"0 0 760 300\" font-family=\"Helvetica, Arial, sans-serif\">\n  <!-- Internet -> Tổng -->\n  <line x1=\"120\" y1=\"150\" x2=\"152\" y2=\"150\" stroke=\"#888\" stroke-width=\"3\"/>\n  <!-- Tổng chẻ thành TN (trên) + QT (dưới) -->\n  <line x1=\"260\" y1=\"146\" x2=\"300\" y2=\"90\"  stroke=\"#27ae60\" stroke-width=\"3\"/>\n  <line x1=\"260\" y1=\"154\" x2=\"300\" y2=\"211\" stroke=\"#e67e22\" stroke-width=\"3\"/>\n  <!-- TN/QT gộp vào PA -->\n  <line x1=\"432\" y1=\"89\"  x2=\"470\" y2=\"140\" stroke=\"#27ae60\" stroke-width=\"3\"/>\n  <line x1=\"432\" y1=\"211\" x2=\"470\" y2=\"166\" stroke=\"#e67e22\" stroke-width=\"3\"/>\n  <!-- sau PA: 1 line duy nhất vào LAN -->\n  <line x1=\"570\" y1=\"152\" x2=\"650\" y2=\"150\" stroke=\"#8aa0b8\" stroke-width=\"4\"/>\n  <!-- Internet -->\n  <ellipse cx=\"68\" cy=\"150\" rx=\"52\" ry=\"40\" fill=\"#2a2a2a\" stroke=\"#888\"/>\n  <text x=\"68\" y=\"155\" fill=\"#e0e0e0\" text-anchor=\"middle\" font-size=\"16\">Internet</text>\n  <!-- Tổng (cell text, có box tĩnh phía sau, căn giữa line) -->\n  <rect x=\"152\" y=\"134\" width=\"108\" height=\"32\" rx=\"6\" fill=\"#333\" stroke=\"#888\"/>\n  <g id=\"cell-total\"><text x=\"206\" y=\"154\" fill=\"#e0e0e0\" text-anchor=\"middle\" font-size=\"12\">Tổng</text></g>\n  <!-- TN box + label -->\n  <g id=\"cell-domestic-box\"><rect x=\"300\" y=\"72\" width=\"132\" height=\"34\" rx=\"6\" fill=\"#1e7a3c\" stroke=\"#27ae60\"/></g>\n  <g id=\"cell-domestic\"><text x=\"366\" y=\"93\" fill=\"#ffffff\" text-anchor=\"middle\" font-size=\"12\">TN</text></g>\n  <!-- QT box + label -->\n  <g id=\"cell-international-box\"><rect x=\"300\" y=\"194\" width=\"132\" height=\"34\" rx=\"6\" fill=\"#a05a1e\" stroke=\"#e67e22\"/></g>\n  <g id=\"cell-international\"><text x=\"366\" y=\"215\" fill=\"#ffffff\" text-anchor=\"middle\" font-size=\"12\">QT</text></g>\n  <!-- PA -->\n  <rect x=\"470\" y=\"122\" width=\"100\" height=\"60\" rx=\"8\" fill=\"#7a1f1f\" stroke=\"#c0392b\"/>\n  <text x=\"520\" y=\"147\" fill=\"#fff\" text-anchor=\"middle\" font-size=\"14\">Palo Alto</text>\n  <text x=\"520\" y=\"165\" fill=\"#ddd\" text-anchor=\"middle\" font-size=\"11\">FW01</text>\n  <!-- LAN: nhiều VM (box xếp chồng) -->\n  <rect x=\"662\" y=\"128\" width=\"90\" height=\"50\" rx=\"8\" fill=\"#22304d\" stroke=\"#3a6ea5\"/>\n  <rect x=\"650\" y=\"120\" width=\"90\" height=\"50\" rx=\"8\" fill=\"#2a3a5a\" stroke=\"#4a90d9\"/>\n  <text x=\"695\" y=\"141\" fill=\"#fff\" text-anchor=\"middle\" font-size=\"13\">LAN</text>\n  <text x=\"695\" y=\"158\" fill=\"#cfe0f5\" text-anchor=\"middle\" font-size=\"10\">nhiều VM</text>\n</svg>",
        "panelConfig": "---\ncellIdPreamble: \"cell-\"\ncells:\n  total:\n    dataRef: \"WAN In (ethernet1/1)\"\n    label: {separator: \"space\", units: \"bps\", decimalPoints: 1}\n  domestic-box:\n    dataRef: \"QoS Domestic throughput\"\n    fillColor:\n      thresholds:\n        - {color: \"dark-green\", level: 0}\n        - {color: \"green\", level: 1000000}\n        - {color: \"orange\", level: 5000000}\n        - {color: \"red\", level: 20000000}\n  domestic:\n    dataRef: \"QoS Domestic throughput\"\n    label: {separator: \"space\", units: \"bps\", decimalPoints: 1}\n  international-box:\n    dataRef: \"QoS International throughput\"\n    fillColor:\n      thresholds:\n        - {color: \"dark-orange\", level: 0}\n        - {color: \"orange\", level: 1000000}\n        - {color: \"red\", level: 5000000}\n  international:\n    dataRef: \"QoS International throughput\"\n    label: {separator: \"space\", units: \"bps\", decimalPoints: 1}"
      },
      "targets": [
        { "refId": "A", "queryType": "0", "resultFormat": "time_series", "datasource": { "type": "alexanderzobnin-zabbix-datasource", "uid": "${DS_ZABBIX}" }, "group": { "filter": "/.*/" }, "host": { "filter": "Palo-Alto-FW01" }, "application": { "filter": "" }, "itemTag": { "filter": "" }, "item": { "filter": "WAN In (ethernet1/1)" }, "functions": [], "options": { "showDisabledItems": false } },
        { "refId": "B", "queryType": "0", "resultFormat": "time_series", "datasource": { "type": "alexanderzobnin-zabbix-datasource", "uid": "${DS_ZABBIX}" }, "group": { "filter": "/.*/" }, "host": { "filter": "Palo-Alto-FW01" }, "application": { "filter": "" }, "itemTag": { "filter": "" }, "item": { "filter": "QoS Domestic throughput" }, "functions": [], "options": { "showDisabledItems": false } },
        { "refId": "C", "queryType": "0", "resultFormat": "time_series", "datasource": { "type": "alexanderzobnin-zabbix-datasource", "uid": "${DS_ZABBIX}" }, "group": { "filter": "/.*/" }, "host": { "filter": "Palo-Alto-FW01" }, "application": { "filter": "" }, "itemTag": { "filter": "" }, "item": { "filter": "QoS International throughput" }, "functions": [], "options": { "showDisabledItems": false } }
      ]
    }
  ]
}
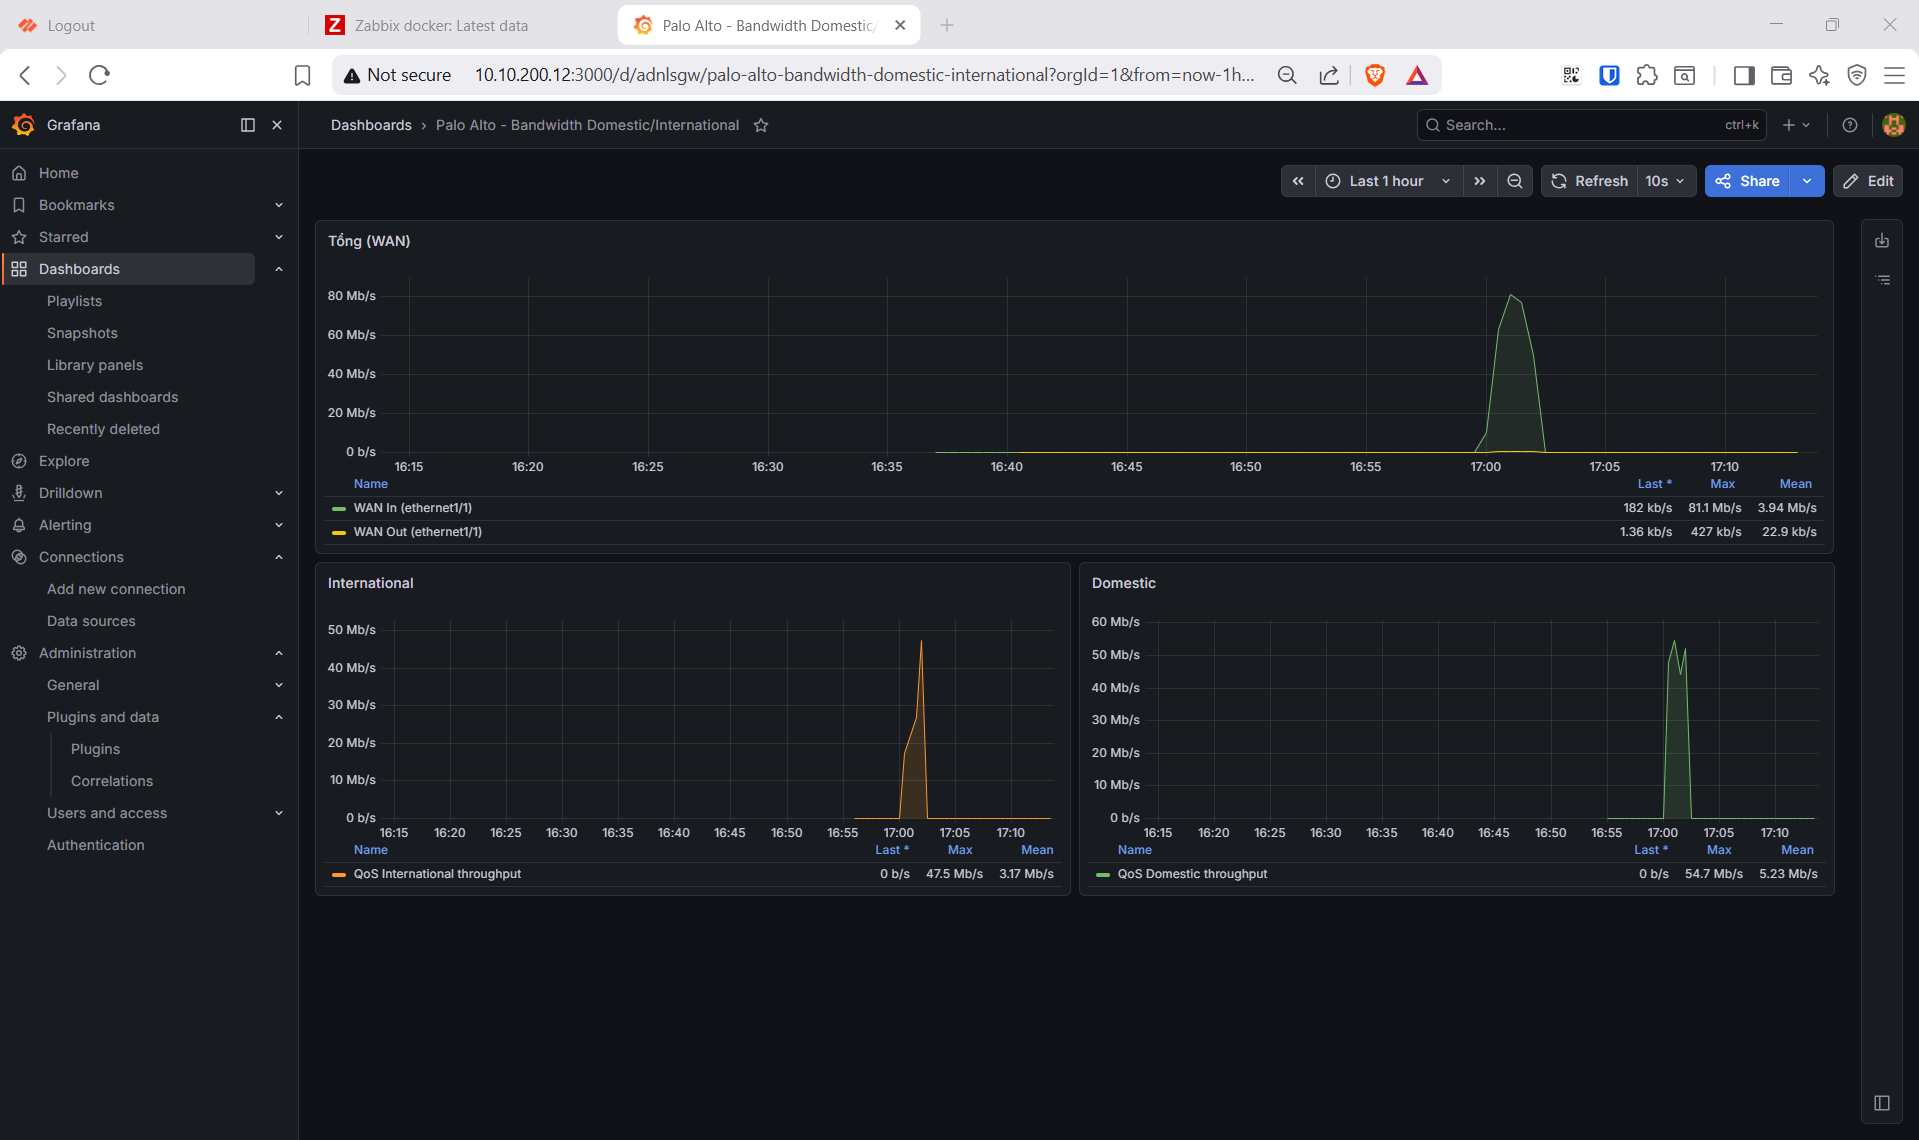
Import xong nếu panel trống: mở query của panel, xóa filter Item tag (item tự tạo không có tag), chọn lại Item đúng tên.
legend.calcs: [lastNotNull, max, mean]chính là phần hiện số Last/Max/Mean dưới đồ thị.
Dựng tay (thay cho import): mỗi panel Add visualization (Zabbix) → Query: Group Discovered hosts, Host Palo-Alto-FW01, xóa Item tag, Item = tên item; Unit bits/sec (SI); Legend → Table, tick Last, Max, Mean.
8b. Flow Panel — sơ đồ băng thông động
Mục tiêu: thay vì 3 đồ thị rời, vẽ một sơ đồ topology Internet → PA → LAN, số TN/QT/Tổng nhảy real-time ngay trên link và đổi màu theo tải — tương đương Zabbix Map nhưng nằm trong Grafana. Dùng plugin andrewbmchugh-flow-panel đã cài sẵn ở Step 6 (GF_INSTALL_PLUGINS).
Plugin ghép 3 thứ: một SVG (sơ đồ), một panelConfig (YAML) bind từng ô của SVG với series dữ liệu, và query lấy số liệu. Cơ chế: mỗi ô trong SVG có id cell-<tên>; YAML tham chiếu <tên> (nhờ cellIdPreamble: "cell-"), rồi dataRef khớp tên series Grafana trả về — với Zabbix datasource chính là tên item (vd QoS Domestic throughput).
Cách nhanh nhất — không cần làm gì thêm: JSON import ở Step 8 đã kèm sẵn panel Flow (panel thứ 4, type: andrewbmchugh-flow-panel) — SVG + panelConfig + 3 query đều nhúng thẳng trong JSON. Import xong là có luôn, bỏ qua các bước dưới.
Nếu tự thêm panel bằng tay (hoặc gặp lỗi This page contains the following errors ... Document is empty):
⚠️ Lỗi
Document is emptylà do 2 ô SVG và Panel Config trong options mặc định điền URL example của github (https://raw.githubusercontent.com/andymchugh/...) — khi URL không tải được, panel render rỗng. Cách sửa: xóa sạch URL trong cả 2 ô, dán nội dung inline (SVG + YAML) ở dưới vào.
1. Tạo panel: Dashboards → New → New dashboard → Add visualization, chọn data source Zabbix, đổi loại visualization (góc trên phải) sang Flow.
2. Thêm 3 query (giống Step 8), mỗi query 1 item — tên series phải đúng để khớp dataRef:
| refId | Item |
|---|---|
| A | WAN In (ethernet1/1) |
| B | QoS Domestic throughput |
| C | QoS International throughput |
Query Zabbix: Group
Discovered hosts· HostPalo-Alto-FW01· xóa Item tag · Item = tên ở bảng. Không đổi Legend format — để nguyên tên item làm series name.
3. Dán SVG vào ô SVG (mục Flow → SVG) — xóa URL mặc định trước, rồi dán:
<svg xmlns="http://www.w3.org/2000/svg" width="760" height="300" viewBox="0 0 760 300" font-family="Helvetica, Arial, sans-serif">
  <!-- Internet -> Tổng -->
  <line x1="120" y1="150" x2="152" y2="150" stroke="#888" stroke-width="3"/>
  <!-- Tổng chẻ thành TN (trên) + QT (dưới) -->
  <line x1="260" y1="146" x2="300" y2="90"  stroke="#27ae60" stroke-width="3"/>
  <line x1="260" y1="154" x2="300" y2="211" stroke="#e67e22" stroke-width="3"/>
  <!-- TN/QT gộp vào PA -->
  <line x1="432" y1="89"  x2="470" y2="140" stroke="#27ae60" stroke-width="3"/>
  <line x1="432" y1="211" x2="470" y2="166" stroke="#e67e22" stroke-width="3"/>
  <!-- sau PA: 1 line duy nhất vào LAN -->
  <line x1="570" y1="152" x2="650" y2="150" stroke="#8aa0b8" stroke-width="4"/>
  <!-- Internet -->
  <ellipse cx="68" cy="150" rx="52" ry="40" fill="#2a2a2a" stroke="#888"/>
  <text x="68" y="155" fill="#e0e0e0" text-anchor="middle" font-size="16">Internet</text>
  <!-- Tổng: box tĩnh + cell text, căn giữa line -->
  <rect x="152" y="134" width="108" height="32" rx="6" fill="#333" stroke="#888"/>
  <g id="cell-total"><text x="206" y="154" fill="#e0e0e0" text-anchor="middle" font-size="12">Tổng</text></g>
  <!-- TN/QT: mỗi ô tách 2 cell — *-box tô nền (fillColor), cell chữ giữ label (số) -->
  <g id="cell-domestic-box"><rect x="300" y="72" width="132" height="34" rx="6" fill="#1e7a3c" stroke="#27ae60"/></g>
  <g id="cell-domestic"><text x="366" y="93" fill="#ffffff" text-anchor="middle" font-size="12">TN</text></g>
  <g id="cell-international-box"><rect x="300" y="194" width="132" height="34" rx="6" fill="#a05a1e" stroke="#e67e22"/></g>
  <g id="cell-international"><text x="366" y="215" fill="#ffffff" text-anchor="middle" font-size="12">QT</text></g>
  <!-- PA -->
  <rect x="470" y="122" width="100" height="60" rx="8" fill="#7a1f1f" stroke="#c0392b"/>
  <text x="520" y="147" fill="#fff" text-anchor="middle" font-size="14">Palo Alto</text>
  <text x="520" y="165" fill="#ddd" text-anchor="middle" font-size="11">FW01</text>
  <!-- LAN: nhiều VM (box xếp chồng) -->
  <rect x="662" y="128" width="90" height="50" rx="8" fill="#22304d" stroke="#3a6ea5"/>
  <rect x="650" y="120" width="90" height="50" rx="8" fill="#2a3a5a" stroke="#4a90d9"/>
  <text x="695" y="141" fill="#fff" text-anchor="middle" font-size="13">LAN</text>
  <text x="695" y="158" fill="#cfe0f5" text-anchor="middle" font-size="10">nhiều VM</text>
</svg>
4. Dán panelConfig vào ô Panel Config (mục Flow → Panel Config) — cũng xóa URL mặc định trước:
---
cellIdPreamble: "cell-"
cells:
  total:
    dataRef: "WAN In (ethernet1/1)"
    label: {separator: "space", units: "bps", decimalPoints: 1}
  domestic-box:                       # cell nền — chỉ tô màu theo tải
    dataRef: "QoS Domestic throughput"
    fillColor:
      thresholds:
        - {color: "dark-green", level: 0}
        - {color: "green",      level: 1000000}
        - {color: "orange",     level: 5000000}
        - {color: "red",        level: 20000000}
  domestic:                           # cell chữ — hiện số, giữ màu trắng
    dataRef: "QoS Domestic throughput"
    label: {separator: "space", units: "bps", decimalPoints: 1}
  international-box:
    dataRef: "QoS International throughput"
    fillColor:
      thresholds:
        - {color: "dark-orange", level: 0}
        - {color: "orange",      level: 1000000}
        - {color: "red",         level: 5000000}
  international:
    dataRef: "QoS International throughput"
    label: {separator: "space", units: "bps", decimalPoints: 1}
label(units: bps,decimalPoints: 1) hiện số kiểuTN 285 kb/s— Grafana tự đổibps → kb/s → Mbit/s.thresholdslà bps — trùng ngưỡng Zabbix Map:1M🟢,5M🟠,20M/5M🔴. Chỉnh ngưỡng theo link WAN thật.
Vì sao tách 2 cell (
*-box+ cell chữ)? Plugin ghi giá trị label vào chính phần tử<text>, rồifillColortô màu nền lên đúng phần tử đó → chữ bị tô cùng màu nền, biến mất (đây là lý do lúc đầu TN/QT chỉ có màu, không thấy số). Cách chắc chắn: cell*-box(chỉ có<rect>) nhậnfillColortô nền, cell chữ (chỉ có<text fill="#fff">) nhậnlabelhiện số — hai việc không đè nhau.labelColorkhông dùng được ở đây vì với SVG<text>thô nó chỉ set CSScolor(vô tác dụng, màu chữ SVG ăn theofill).
Ô trống / không đổi màu? Bấm nút Debug data (icon trong panel) → xem console log tên series Grafana thực tế, sửa
dataRefcho khớp từng ký tự (kể cả(ethernet1/1)). Đây là lỗi hay gặp nhất: series name lệch tên item là cell không nhận dữ liệu.Panel có sẵn time-slider + animation (bật
Animations/Time Slidertrong options) để tua lại và xem dòng băng thông biến thiên theo thời gian — hữu ích khi review lúc sinh traffic ở Step 10.
Step 9: Zabbix Network Map
Mục tiêu: topology cloud Internet ↔ PA, link hiện nhãn TN/QT + đổi màu theo tải.
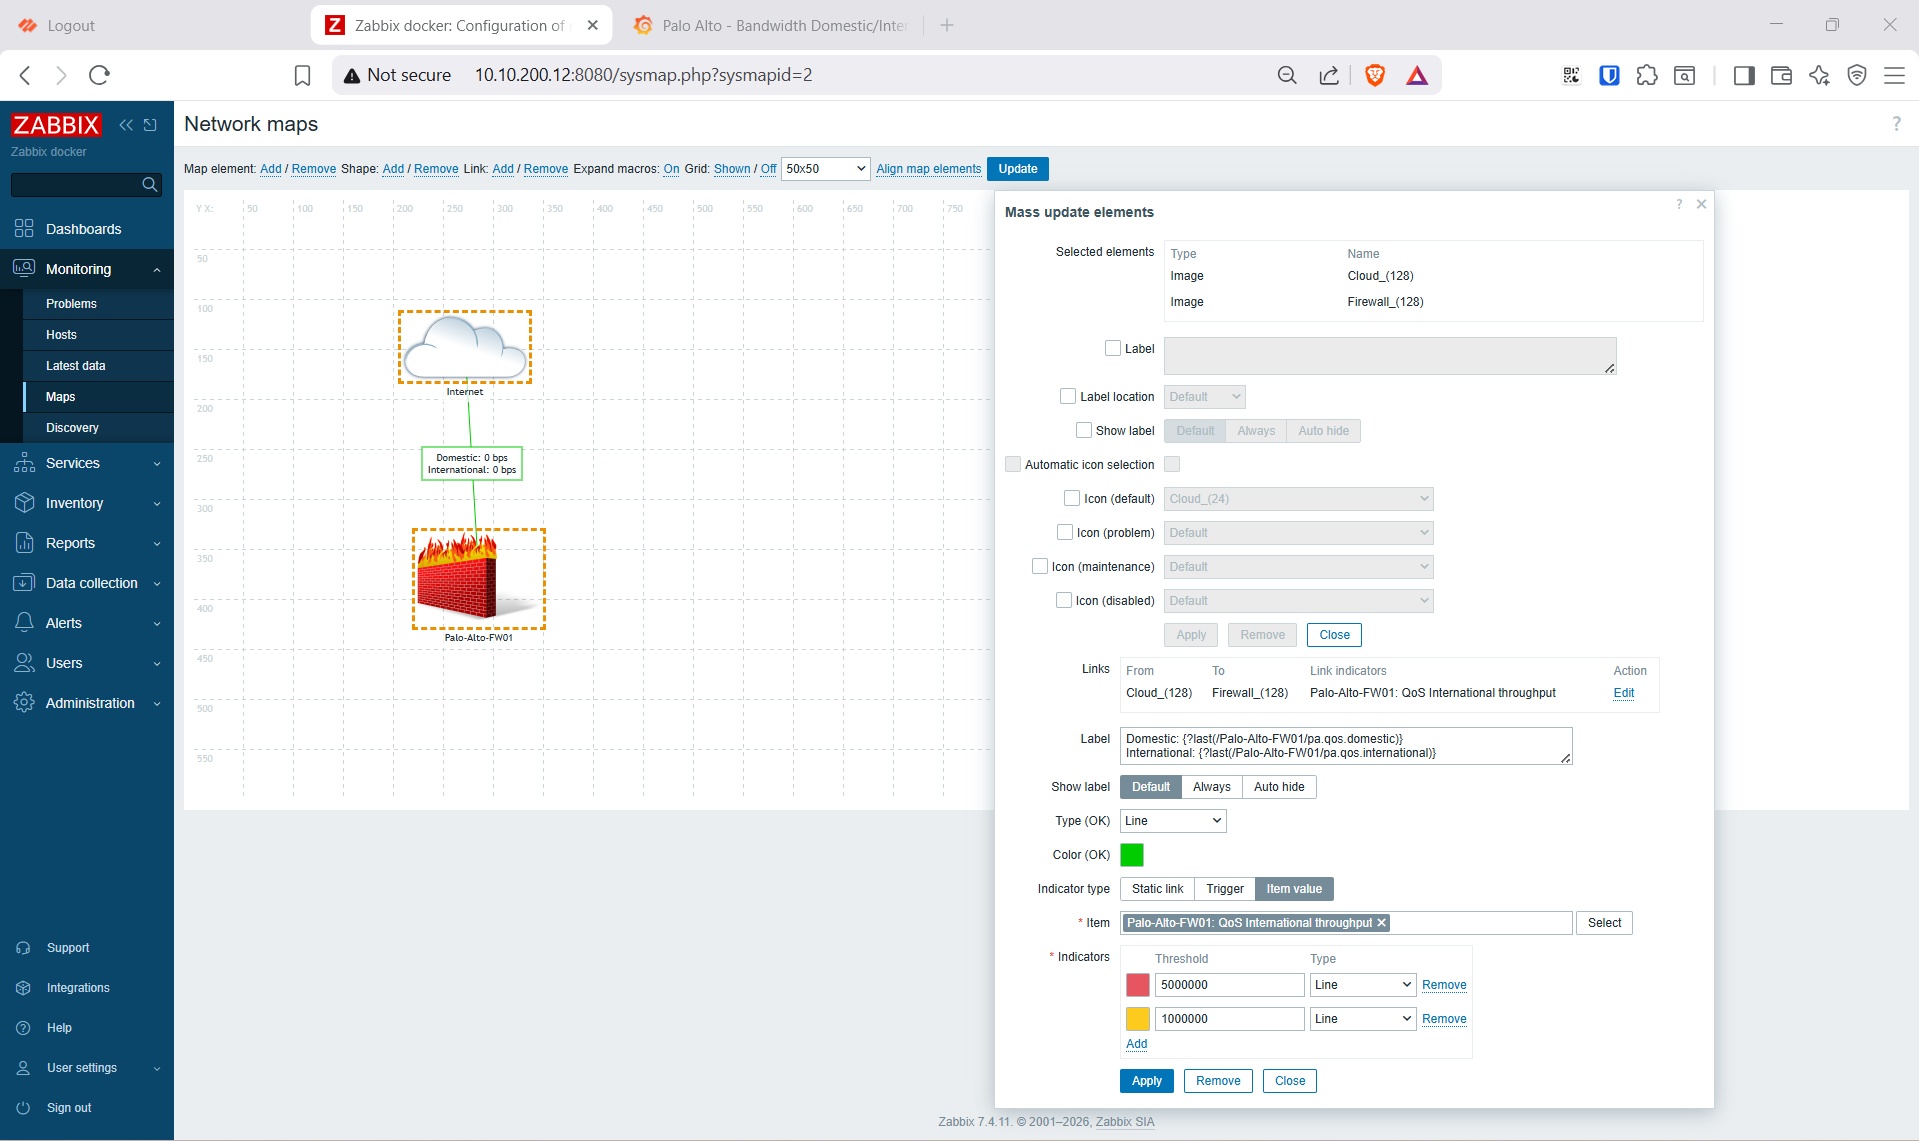
Monitoring → Maps → Create map (PA-Bandwidth-Map):
- Thêm icon Cloud (đặt tên Internet) và icon host Palo-Alto-FW01.
- Nối link giữa 2 icon → Edit:
- Label (đúng Host name
Palo-Alto-FW01):Domestic: {?last(/Palo-Alto-FW01/pa.qos.domestic)} International: {?last(/Palo-Alto-FW01/pa.qos.international)} - Indicator type =
Item value→ ItemPalo-Alto-FW01: QoS International throughput; Thresholds (chỉ số, bps):5000000🔴,1000000🟡 (còn lại 🟢). Chỉnh ngưỡng theo tải thực.
- Label (đúng Host name
- Apply → Update. Bấm Expand macros: On để preview số.
Macro map:
{?last(/<Host name>/<Item key>)}—<Host name>phải y hệt tên host trong Zabbix, không phải tên icon trên map.
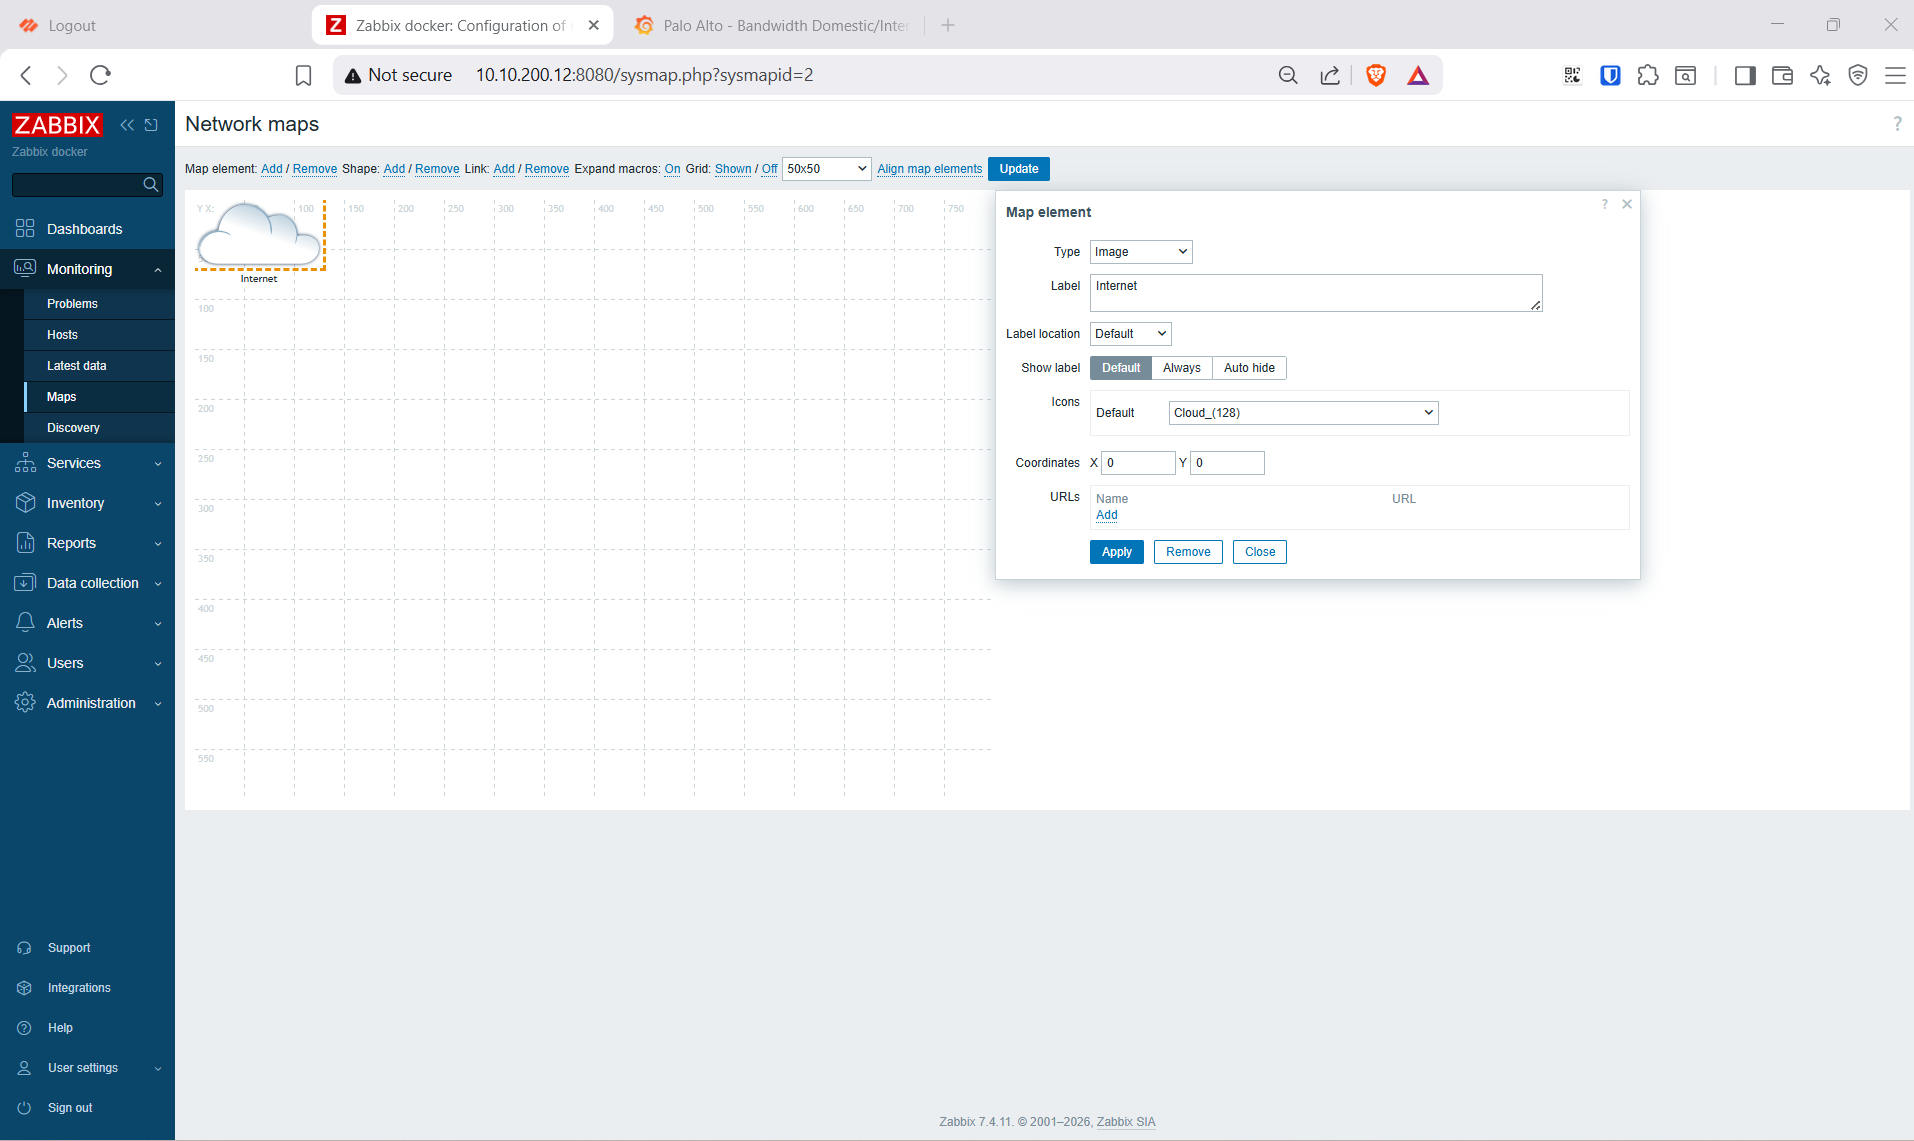
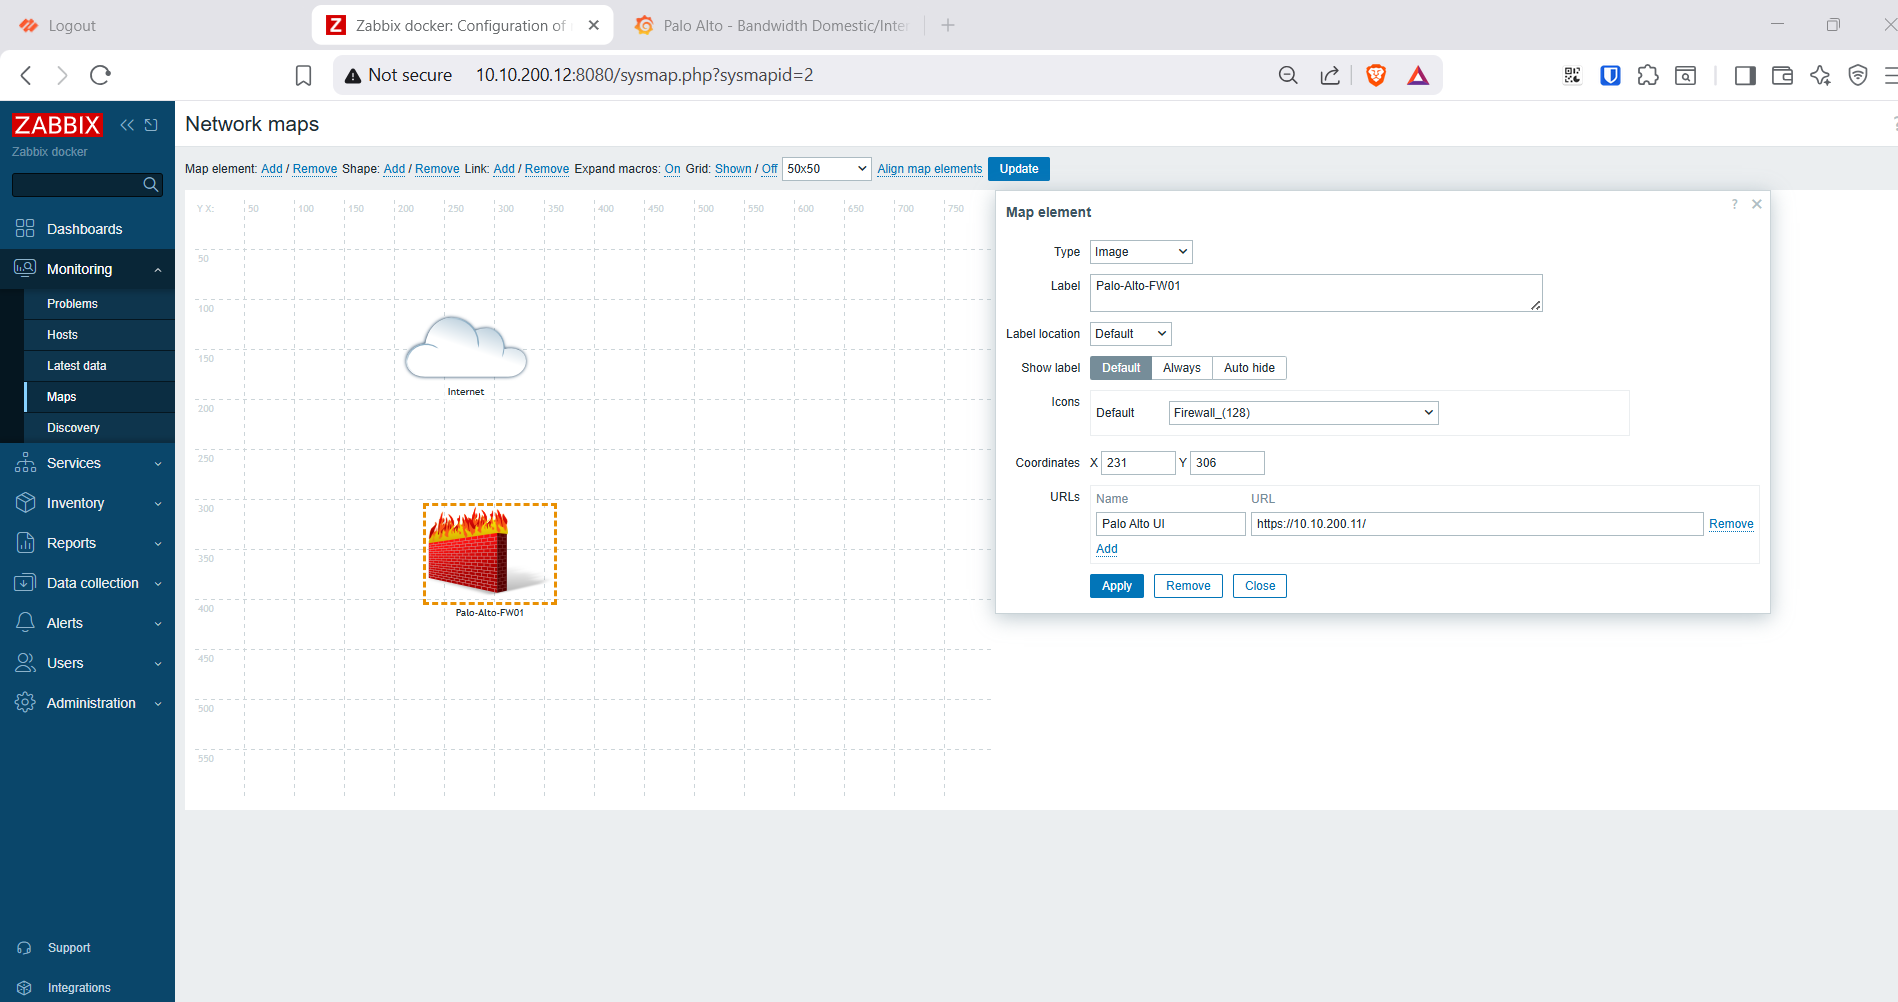
Step 10: Sinh traffic và kiểm chứng
Trên Zabbix01 (traffic đi qua PA nhờ default route VLAN201):
# Quốc tế (QT) — tải file lớn từ máy chủ đặt ở nước ngoài (OVH, Pháp)
while true; do curl -s -o /dev/null "https://proof.ovh.net/files/1Gb.dat"; done &

# Trong nước (TN) — tải file ISO lớn từ mirror trong nước (IP thuộc dải VN)
while true; do curl -s -o /dev/null "https://mirror.bizflycloud.vn/ubuntu-releases/24.04/ubuntu-24.04.1-live-server-amd64.iso"; done &
Verify IP trước khi test — cả 2 chiều:
- Site QT phải có IP KHÔNG nằm trong EDL:
dig +short proof.ovh.net→request system external-list show type ip name VN-Domestic-EDL | match <prefix>phải rỗng. KHÔNG dùngcloudflare/Google/YouTube làm QT — chúng có PoP/cache tại VN nên IP hay bị EDL xếp vào dải VN → traffic ra class 4 (TN) dù là dịch vụ nước ngoài.- Site TN phải có IP VN:
dig +short mirror.bizflycloud.vn→ cùng lệnhmatchphải thấy prefix. Đổi mirror ISP khác (Viettel/FPT/VNPT) cũng được, miễn IP thuộc dải VN.Vì rule
International-*đểany, mọi traffic không khớp EDL đều rơi vào class 5 — nên class 4 xuất hiện khi tải site QT = IP đó đang bị EDL coi là VN, đổi site khác là hết.
Dừng (nhớ pkill curl không dừng được vòng while true vì nó respawn — phải kill job):
kill $(jobs -p) 2>/dev/null; pkill curl
Kiểm tra kết quả
Trên PA (real-time, có traffic đang chạy):
show qos interface ethernet1/2 throughput 1
# node download (Qid 1):  class 4: <kbps> TN | class 5: <kbps> QT
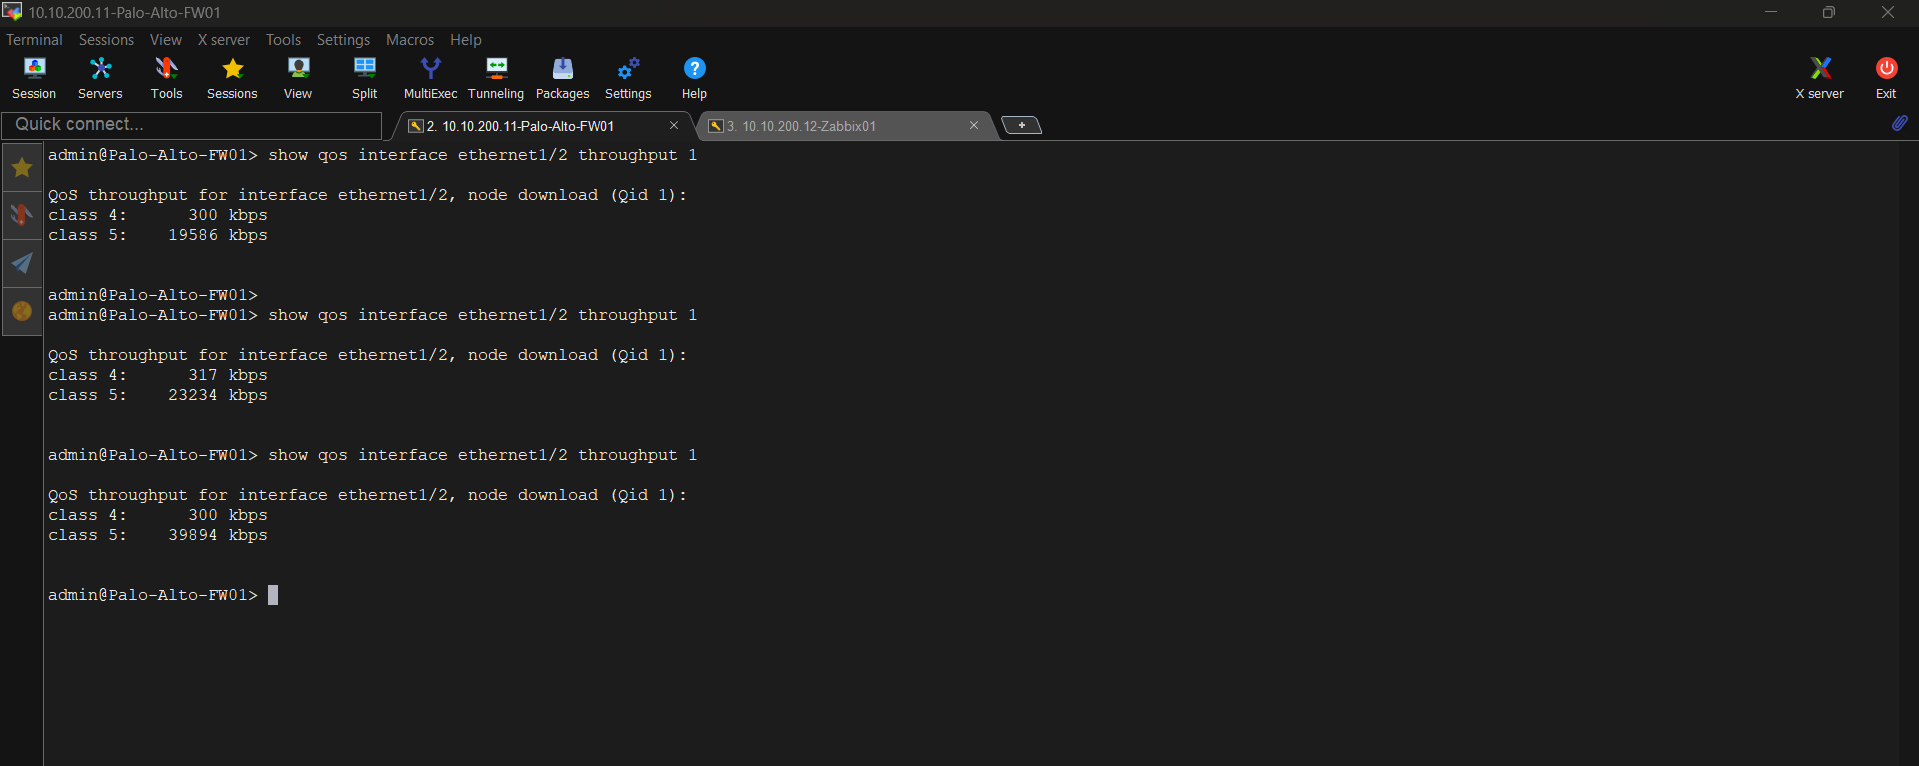
Trên Zabbix — Monitoring → Latest data → WAN In/Out, QoS Domestic/International throughput có số.
Trên Zabbix Map: link Internet ↔ PA hiện nhãn TN/QT real-time, đổi màu 🟢🟡🔴 theo băng thông QT.
Trên Grafana:
- Panel Tổng (WAN In) ≈ QT + TN — vì cùng đo luồng download (WAN In vào eth1/1 = download ra eth1/2). Số Last/Max/Mean hiện ngay dưới đồ thị.
- Tải từ mirror trong nước (IP VN) → TN tăng; tải
proof.ovh.net/máy chủ nước ngoài → QT tăng.
So bằng cột Mean, KHÔNG so cột Last. Last là 1 điểm tức thời — SNMP (WAN In) và API (TN/QT) poll ở thời điểm khác nhau + traffic bursty nên Last giữa 2 panel hay lệch. Trung bình (Mean) mới phản ánh đúng:
WAN In Mean ≈ (TN + QT) Mean. WAN In thường cao hơn TN+QT một chút — đúng bản chất, vì WAN In gồm cả traffic PA tự tải (EDL, DNS, content) đi vào WAN nhưng không ra LAN nên không nằm trong TN/QT. Quan hệWAN In ≥ TN + QTluôn đúng.Spike ảo trên WAN In/Out: thỉnh thoảng thấy đường Tổng vọt bất thường (vd upload nhảy chục Mb/s) là artifact của
Change per secondtrên Counter64 — một lần poll bị trễ/counter nhảy làm delta tính ra to giả. Xử lý: thêm preprocessingDiscard unchanged with heartbeatvào item, hoặc trên panel Grafana đặt Standard options → Max để giới hạn trục Y. Spike đơn lẻ không ảnh hưởng số liệu TN/QT (lấy từ API, không phải counter).
Kết luận
Lab dựng hệ giám sát Palo Alto 2-VM bằng Zabbix 7.4 + Grafana chạy Docker, giải quyết bài toán cốt lõi: tách băng thông download Trong nước / Quốc tế. Điểm mấu chốt:
- SNMP interface counter chỉ cho Tổng; muốn tách theo địa lý phải phân loại theo IP (QoS + EDL danh sách IP VN) rồi lấy số qua PA XML API — không OID SNMP nào làm thay được.
- Đo ở chiều download (eth1/2 egress) vì đó là băng thông thực; nhờ vậy Tổng ≈ TN + QT khớp nhau.
- Với PA-VM chưa license, EDL là cách tối ưu: không cần license, tự cập nhật, thêm dải custom dễ dàng — GeoIP Region chỉ dùng được khi đã có content license.
Hướng mở rộng:
- Nếu có license: dùng GeoIP Region = Vietnam thay EDL, hoặc bổ sung EDL prefix IPv6.
- Thêm trigger + cảnh báo Zabbix khi băng thông QT vượt ngưỡng hợp đồng ISP.
- Nếu ISP bàn giao TN/QT trên 2 sub-interface riêng (mở ticket nhà mạng), có thể chuyển sang đo thuần SNMP per-subinterface — chính xác hơn và bỏ được phần API.